Spanish
  Chinese
  Russian
  German
  French
  Japanese
  Portuguese
  Hindi
Hindi Research Article, J Soil Sci Plant Health Vol: 1 Issue: 1
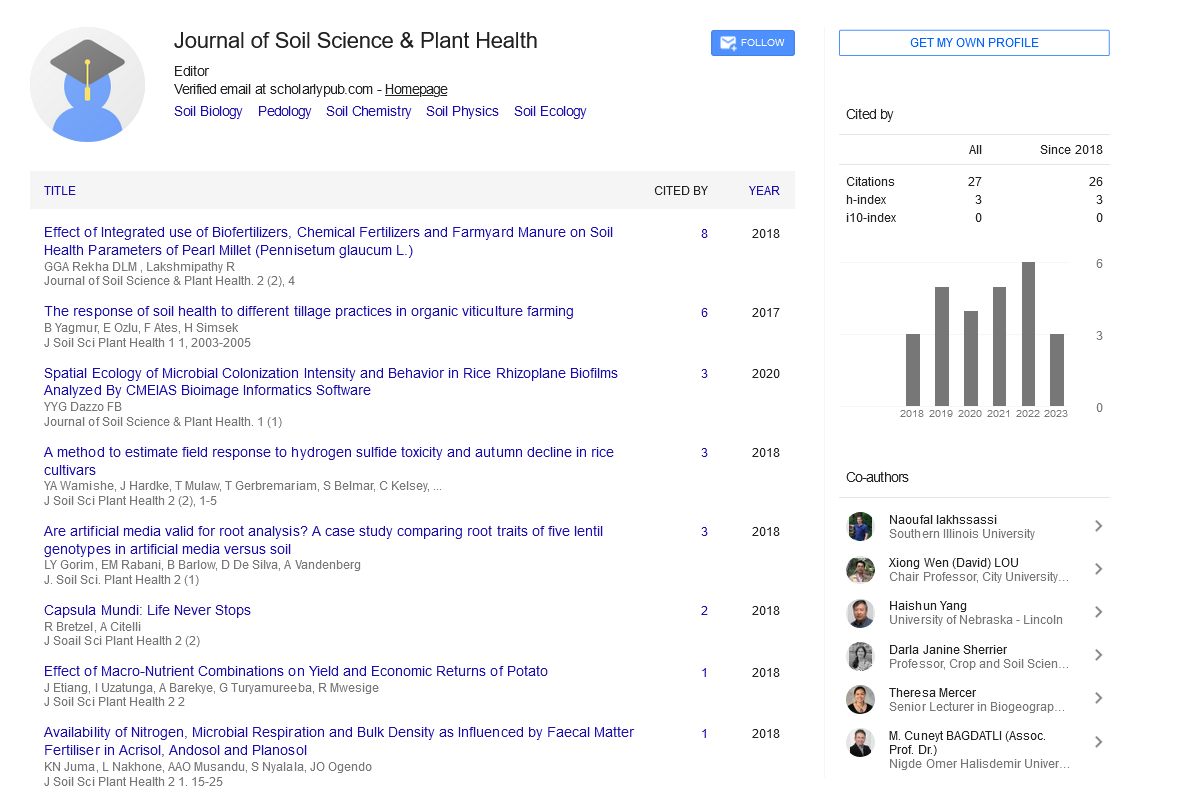
Spatial Ecology of Microbial Colonization Intensity and Behavior in Rice Rhizoplane Biofilms Analyzed By CMEIAS Bioimage Informatics Software
1Department of Microbiology & Molecular Genetics, Michigan State University, Michigan 48824, USA
2Department of Microbiology, Sakha Agricultural Research Station, Kafr El-Sheikh, 33717, Egypt
*Corresponding Author : Frank B Dazzo
Department of Microbiology and Molecular Genetics, Michigan State University, East Lansing, Michigan 48824, USA
Tel: 517-884-5394
E-mail: dazzo@msu.edu, yanni244@yahoo.com
Received: August 11, 2017 Accepted: August 13, 2017 Published: August 20, 2017
Citation: Dazzo FB, Yanni YG (2017) Spatial Ecology of Microbial Colonization Intensity and Behavior in Rice Rhizoplane Biofilms Analyzed By CMEIAS Bioimage Informatics Software. J Soil Sci Plant Health 1:1.
Abstract
CMEIAS (Center for Microbial Ecology Image Analysis System) Bioimage Informatics software is designed to strengthen microscopy-based approaches for understanding microbial ecology at spatial scales directly relevant to ecological functions performed by individual cells and microcolonies. Copyrighted software components are thoroughly documented and provided as free downloads at <cme.msu.edu/cmeias/>. The software tools already released include CMEIAS-Image Tool v. 1.28, CMEIAS Color Segmentation, CMEIAS Quadrat Maker and CMEIAS JFrad Fractal Dimension analysis. The spatial ecology module of the next CMEIAS upgrade currently being developed (version 4.0) is designed to extract data from images for analysis of plotless point-patterns, quadrat-lattice patterns, geostatistical autocorrelation and fractal geometry of cells within biofilms. Examples presented here illustrate how selected CMEIAS attributes can be used to analyze the in situ spatial intensity, pattern of distribution, and colonization behavior of an indigenous population of a rhizobial strain on a sampled image of the rhizoplane landscape of a rice plant grown in field soil. The spatial ecology information gained can provide useful insights that help to predict the most likely performance of the biofertilizer test strain in relation to the growth response of the crop under field conditions.
Keywords: Biofertilization; Biofilm; CMEIAS Bioimage informatics; Computer-Assisted microscopy; Image analysis; Spatial ecology
Introduction
Microbial lifestyles in association with plants are dominated by biofilm assemblages colonized on their root surfaces at root/soil interfaces, which can significantly impact on plant growth and crop productivities. The complex architectures of such microbial biofilms are amenable to computer-assisted microscopy and digital image analysis. The quantitative data gained by these analyses can bridge with modern genotypic technologies to fill gaps of phenotypic information on the in situ biofilm ecology of microbial populations and community assemblages. We have been developing a comprehensive suite of CMEIAS Bioimage informatics software that strengthen quantitative microscopy-based approaches for supporting microbial ecology research on biofilm development and ecology, thereby providing new and improved computing tools for image acquisition, processing and segmentation, object analysis and classification, data processing, statistical analysis and exploratory data mining. After completion, the copyrighted software technologies and their documentations are released as free downloads at our project website: <cme.msu.edu/cmeias/>.
Historically, the first release version of CMEIAS featured components for analysis of object size, shape, luminosity, a single-variable classifier, and a sophisticated hierarchical-supervised classifier for all major and most minor microbial morphotypes [1]. We next developed a CMEIAS Color Segmentation tool for analysis of the foreground objects within complex RGB (red green blue) digital images where color differentiation really matters most, e.g., ecophysiological studies of organisms in situ [2]. For instance, this color segmentation tool provided key image processing functions to accurately analyze the requirements for bacterial cell-cell communication by biosensor reporter strains during their colonization on plant roots in situ, indicating that the quorum population requirement was much smaller than originally thought (as few as 2 individual cells) and also identifying the major importance of spatial positioning of cells within gradients of external signal molecules to participate in successful cell-cell communication [3]. The CMEIAS Color Segmentation tool also helps to segment RGB images of bacterial cells specifically detected with fluorescent molecular probes (e.g., fluorescence-in situ hybridization or immunofluorescence microscopy) when background autofluorescence and non-specific staining are present in environmental samples [4]. We next released a CMEIAS Quadrat Maker software application to optimize the grid dimensions that divide landscape images into smaller, constant size contiguous quadrats for high-resolution plot-based spatial pattern analysis of cells within biofilms [5]. Our most recent software release was a CMEIAS JFrad application designed to discriminate complex biofilm architectures based on the uniqueness of their self-similar fractal geometry [6]. It uniquely features algorithms to compute 11 different fractal dimensions along microcolony biofilm coastlines, and also can discriminate the spatial patterns of individual cells in the biofilm domain. Its protocols are optimally designed for data mining the quantitative analytical results in order to provide insights of landscape ecology that address the complexity of biofilm architecture and colonization behavior. This fractal feature of biofilm architecture is attributed to the elevated efficiency of cell positioning in relation to the scale-dependent heterogeneous fractal variability in limiting resource partitioning, especially when faced with interactive forces of microbial coexistence to maximize and compete for their apportionment of nutrient resources on a local scale in the surrounding environment [6-11].
Ecosystem function is heavily dependent on spatially structured heterogeneity among its members [6-9,11-15]. This ecological relationship provides the impetus to include a spatial analysis module in the next release prototype of CMEIAS (ver. 4.0) [summary available at https://lter.kbs.msu.edu/abstracts/555/. This module is designed to explore the microbial biogeography of biofilm assemblages across multiple spatial scales, and includes measurement attributes for plot-less point pattern, plot-based quadrat-lattice spatial dispersion, fractal dimension and geostatistical analyses of their spatial patterns of distribution at single-cell and microcolony resolutions [1,6,8,16,17].
The output data can then be further evaluated by various spatial statistics to indicate their colonization intensity and reveal insights of their colonization behaviors in situ [3-8,16,17], all driven by the ecological theory of optimal spatial positioning of organisms in order to maximize their efficiency in utilization of nutrient resource allocations and participate in cell-cell communication [3,6-15]. Analysis of these in situ spatial patterns of microbial distributions within immature biofilms (i.e., before growth expansion completely covers the supporting substratum) provides data that support statistically defendable ecological theories of biogeography, indicating that their early colonization behavior involves a spatially explicit process affecting their patterns of distribution within their microenvironment [7-15,18]. Spatial dependence is considered positive when neighboring organisms aggregate due to cooperative interactions that promote their localized productive growth, and is considered negative when conflicting/ inhibitory interactions are expressed resulting in their uniform, self-avoiding colonization behavior [3,7,8,12-15,18,19]. Thus, a major use of the CMEIAS spatial ecology module is to test the null hypothesis of spatial randomness for the 2-dimensional distribution of organisms within the biofilm landscape, which contrasts to various spatially dependent and explicit processes from which the positive vs. negative type and intensity of their colonization behavior can be deduced. When computed from images of immature microbial biofilms, these categories of colonization behavior provide statistically defendable predictions of their in situ cooperative (aggregately distributed) vs. conflicting (uniformly distributed) cell-cell interactions within the spatially structured landscape [3-8,12-15,17-19].
Here we describe the use of selected CMEIAS spatial attributes to analyze the distribution of indigenous cells of a beneficial rhizobial strain in a sampled landscape image of its rhizoplane biofilm on a rice plant grown on samples of field soil collected from rice production areas in the Egypt Nile delta. The extracted data of its spatial abundance, substratum-weighted intensity and pattern of distribution are then evaluated by spatial statistics to provide insights on its colonization behavior in situ. This information is useful in the assessment of biofertilizer performance by selected strains of plant growth-promoting rhizobacteria in field inoculation studies conducted where indigenous populations of the same strain may already be present in the field soil. Otherwise, the lack of this information may inevitably compromise the final assessment of inoculation benefit to the crop growth and yield.
Materials and Methods
Seeds of rice (Oryza sativa) variety Giza 177 were grown for 20 days in a sampled clay loamy field soil with the following properties: pH: 7.3; electrical conductivity range: 1.9 -12.8 dS-1; CaCO3 (%): 1 .4 - 2.9; sodium adsorption ratio: 2.9 - 7.2; exchangeable-Na percentage: 2.9 - 16.0; organic matter (%) 1.8 - 2.0; cation exchange capacity (meq/100 g): 41.7 - 50.0; available-N (ppm): 485 - 947; available-P (P2O5): 12.3 - 19.4; available-K (K2O): 38.0 - 73.5; soil texture: loamy, containing 21.6 - 24.8% clay; 41.2 - 46.1% silt; and 31.0 - 33.7% sand; and water-saturation: 77.0 - 90.6%. In situ colonization of the rice rhizoplane by the indigenous soil population of Rhizobium leguminosarum bv. trifolii strain E11was examined by indirect immunofluorescence microscopy using a rabbit polyclonal strain-specific antibody [4,17]. This native strain was isolated from roots of rice grown in fields that had been used for crop rotation with berseem clover (Trifolium alexandrinum) for many years [20]. Exploratory field inoculation studies have documented its ability to promote the vegetative growth and grain yield of rice under lab, greenhouse and various open fields in this region [20-22].
The landscape image used for analysis (Figure 1) was acquired by epifluorescence microscopy, digitally processed using Adobe Photoshop CS3 and CMEIAS Color Segmentation [http://cme.msu.edu/cmeias/color.shtml] software to include only the individual brightly immunofluorescent cells, thresholded to find the foreground objects of interest, and then analyzed in situ using CMEIAS software [1-8,16,17]. The extracted data were statistically analyzed using StatistiXL [www.statistixl.com]; PAST [23; folk.uio.no/ohammer/past/], EcoStat [exetersoftware.com/cat/Trinity/ecostat.html], GS+ [gammadesign.com/] and Ecological Methodology [23,24] [www.exetersoftware.com/cat/ecometh/ecomethodology.html] software.

Figure 1: A noise-free, segmented binary image of a sampled landscape of the rice rhizoplane containing a population of the targeted indigenous rhizobial strain detected by immunofluorescence microscopy using a strain-specific antibody against R. leguminosarum bv. trifolii E11.
Results and Discussion
The first set of image analyses involved measurements of the landscape area of the substratum surface, number and size of the individual immunofluorescent bacteria, and then their spatial density, biovolume, biosurface area, and % substratum coverage [7,8,16]. Using these collected data, we computed their substratum-weighted colonization intensities in situ within the domain of this sampled landscape of the rice rhizoplane (Table 1). These metrics of population abundance to some extent reflect their success at competing for limited resources in the substratum microenvironment where they reside [7-9,25]. Therefore the choice of metrics used to measure their abundance among community members can significantly influence how variations in that relationship are interpreted [8]. If needed, further subdivision of biofilm populations and communities based on CMEIAS object analysis and classification of their morphological features can be successfully applied when comparing productivity of the entire rhizoplane community vs. the biofertilizer preparation containing the strain of interest, and certain adaptive responses to environmental stresses at single-cell resolution [1,7,8]. For example, bacterial cells increase their surface area/biovolume ratio when they size down to enhance their nutrient uptake efficiency as a self-induced adaptive response to starvation [26], and cell elongation of certain bacterial taxa will increase their resistance to protozoan bacteriovory stress [27].
Other useful attributes are included in the CMEIAS spatial ecology module. Object analysis attributes reported for each individual cell include the georeferenced location of its object centroid (Cartesian X|Y coordinates relative to the X, Y landmark origin of 0,0 located in the lower left corner of the image), the shortest linear distance between each individual cell and its 1st and 2nd nearest neighbors (NND), the cumulative empirical distribution function of the 1st nearest neighbor distance for each cell, and a cluster index indicating the intensity to which each cell is clustered in close proximity to its neighbors [7,8,16,17]. Pertinent cumulative object analysis attributes reported collectively for all cells in the same landscape image [7,8,16] included the mean / median / std. dev. of the distributions of their 1st and 2nd nearest neighbor distances, and attributes reporting various substratum-weighted quadrat-density data including their spatial density, colonization intensities, cumulative biovolume, cumulative biosurface area, and % substratum coverage as indicated in Table 1, plus other metrics (e.g., distribution of cell counts in different sized quadrats, distance from random point to nearest object) required to test the null hypothesis of spatial randomness for patterns of distribution within the image.
| Spatial Ecology Attribute | Value Obtained |
|---|---|
| Substratum Area of Interest (μm2) | 32,796 |
| Cell Count | 580 |
| Spatial Density (cells / mm2) | 17,685.08 |
| Mean Cell Biovolume (μm3; x ± std. dev) | 1.462 ± 0.435 |
| Cumulative Cell Biovolume (μm3) | 848.047 |
| Colonization Intensity - Cell Biovolume (μm3 / mm2 substratum) | 25,858.37 |
| Mean Cell Biosurface Area (μm2) | 8.79 |
| Cumulative Cell Biosurface Area (μm2) | 5,094.89 |
| Colonization Intensity - Cell Biosurface Area (μm2 / mm2 substratum) | 155,353.39 |
| % Substratum Coverage | 4.27 |
Table 1: Spatial abundance of immunofluorescent rhizobial cells in the sampled landscape image of the rice rhizoplane (Figure 1).
Table 2 lists various spatial point-pattern, quadrat-lattice, geostatistical and fractal geometry analyses of CMEIAS data extracted from the image of immunoreactive cells colonized on this sampled landscape of the rice rhizoplane. Student t and Mann-Whitney statistical tests indicated that the mean and median values of the 1st and 2nd nearest neighbor distances were significantly different (p of equal means and medians are 6.64 × 10⁻³² and 9.54 × 10-60, respectively) and not derived from the same distribution. The Holgate aggregation index [28] was computed from the distribution of each cell’s 1st and 2nd nearest neighbor distances. The Hopkins and Skellum Aggregation index [29] was computed from distributions of their 1st nearest neighbor distance and the distance from an equal number of random points to their nearest objects in the image. The arrays of X|Y object centroid coordinates were used to compute the Clark and Evans Aggregation Index [30,31], kernel point density [23], linear interpoint alignments [23,32] and Ripley K distribution [23,33]. Classifications of spatial patterns were differentiated in cumulative plots of each cell’s empirical distribution function and its corresponding 1st nearest neighbor distance [7,8]. The quadrat indices of dispersion (ratio of variance: mean, Morisita and standardized Morisita indices) were computed from the frequency distribution of quadrat counts [24,34,35]. The cluster index was computed from the 1st nearest neighbor distance for each cell [16,17]. The geostatistical metrics of Moran’s Index and effective range were computed from the best fit semivariogram model of spatial autocorrelation derived from each object’s centroid X|Y coordinates and its associated cluster index as the corresponding “Z variate” [7,17,36]. The mathematical methods of dilation, Eucledian distance mapping, and box counting were used to compute the fractal-like patterns of spatial distribution of individual, aggregated cells [6]. All of these indices rejected the null hypothesis of randomness in spatial distribution of the target bacteria, and provided evidence of strong overall spatial aggregation of cells indicating that their colonization behavior was dominated by positive/cooperative interactions (Table 2).
| Spatial Ecology Attribute | Value | Interpretation |
|---|---|---|
| Mean ± Std. Dev. 1st NND (μm) | 2.72 ± 1.32 | Radial proximity to 1st nearest neighbors |
| Mean ± Std. Dev. 2nd NND (μm) | 3.78 ± 1.65 | Radial proximity to 2nd nearest neighbors |
| Median 1st NND (μm) | 2.45 | Radial proximity to 1st nearest neighbors |
| Median 2nd NND (μm) | 3.41 | Radial proximity to 2nd nearest neighbors |
| Holgate Aggregation Index | 0.582 | Aggregated pattern (> 0.5; p random=0.001) |
| Hopkins & Skellum Aggregation | 9.310 | Aggregated pattern (> 1.0; p random < 0.001) |
| Clark & Evans Aggregation Index | 7.863 | Aggregated pattern (p random=3.76 x 10⁻¹⁵) |
| Interpoint Line Alignments | 142 | Multiple, spatially structured interactions |
| Ripley K Radial Distances | 7.5; 37.5; 67.5 | Minor uniform, multiple dominant clusters |
| Empirical Distribution Function | Sigmoid curve | Minor uniform, dominant clustered |
| Quadrat Dispersion Variance : Mean | 4.29 | Aggregated pattern of dispersion (>1.0) |
| Quadrat Dispersion Morisita Index | 1.140 | Aggregated pattern of dispersion (>1.0) |
| Morisita Standardized Dispersion | 0.502 | Aggregated pattern of dispersion (>0.0) |
| Moran's Index for Cluster Index | (+) 2.808 | Positively autocorrelated clustering |
| Effective range for Cluster Index (µm) | 18.42 | Radial distance of autocorrelated clustering influence |
| Fractal Dimension: Dilation | 1.34562 | Aggregated fractal pattern |
| Fractal Dimension: Eucledian Distance Map | 1.30985 | Aggregated fractal pattern |
| Fractal Dimension: Box Counting | 1.20190 | Aggregated fractal pattern |
Table 2: In situ spatial pattern analyses of R. leguminosarum E11 cells on the rice rhizoplane.
Spatial structure representing an aggregated pattern of distribution for the targeted strain was further indicated in the plots of kernel density, linear interpoint alignments, minimal spanning tree and Ripley’s K multi-distance pattern (Figures 2a-2d), all derived from analysis of the X|Y coordinate locations of the target cells within the landscape rhizoplane image. The spatial map provided by the kernel density analysis (Figure 2a) revealed the pseudocolored gradients in intensity of cell aggregation and probability of (dis)continuity in their local cell density interpolated over the landscape area [7,8,23]. The counts of multidirectional, linear point alignments (Table 2) and their intersections (Figure 2b) predicted a significant abundance of localized epicenters of potential interactions among aggregated microbial cells, indicative of their clustered colonization behavior [7,8,23,32]. The minimal spanning tree displays the nearest-neighbor network of vertices interconnecting all cells into a multi-branched tree with minimal total length, and its plot in Figure 2c identified local aggregated patches with high vertex densities of short length that further corroborate the same location of intense cell-cell interactions predicted by the kernel density and linear point alignment plots. Ripley’s 2nd order spatial analysis evaluates if the point pattern characteristics change with radial distance between cells [23,33], indicating in this case that the vast majority of cells displayed aggregated spatial patterns with a multimodal distribution of their paired separation distances (Figure 2d, Table 2).

Figure 2: Plots of spatial distribution analysis of R. leguminosarum E11 cells colonized on the sampled rhizoplane landscape. A) Interpolated 2-D map of Kernel point density. B) Linear interpoint alignments. C) Minimal spanning tree of E11 cells connected to their 1st nearest neighbors. D) Ripley’s K point pattern classification.
The geostatistical method of spatial pattern analysis is particularly noteworthy, robust and informative. This statistical method measures the degree of dependency among observations in a geographic space to evaluate the variation in continuity of spatial patterns over that entire domain [8,36]. It does so by quantifying the resemblance between neighbors as a function of spatial separation distance [8,36]. Data are autocorrelated when nearby neighbor pairs are more similar than far neighbor pairs, as commonly occur when the cell distribution is strongly aggregated [7,8,36,37]. When found, autocorrelation results can be mathematically modeled to connect various spatially dependent relationships derived from regionalized variable theory [36]. In this study, we used geostatistical methods to explore the variation and connectivity in the continuously distributed “Z-variate” of the cluster index for the targeted population of cells in the sampled landscape domain. A positive sum of the Moran’s Index (Table 2) indicated that this Z-variate was spatially autocorrelated in the landscape, delivered statistically defendable evidence that cell-cell interactions positively influence their neighbors’ aggregated colonization behavior, and indicated that the cooperative spatial aggregation is a dominant pattern/ behavior that significantly exceeds what would be expected if located randomly within the examined geographic space, consistent with the other analysis results.
The geostatistical semivariogram plot (Figure 3) provides several features that define the extent to which the Z-variate exhibits autocorrelated spatial dependence between pairs of all sampled cells [36]. An isotropic exponential model made the best fit of the CMEIAS cluster index as the Z-variate for cells in this landscape image, with a high coefficient of determination (r2=0.900) and low residual sum of squares (2.338 × 10⁻⁵). The nugget value (Y intercept of 0.000010 at X=0 separation distance) indicated the very low amount of measured microstructure that is not spatially dependent over the range of separation distances examined. Its small value also indicated that the sampling points were sufficient in quantity and sampled at the proper spatial scale for this geostatistical analysis [36]. The semivariogram model also indicated the important parameter of effective separation range (the X-axis intercept at 95% of the asymptote height) that defines the maximal separation distance between pairs of sampling points at which the Z variate is still autocorrelated [36]. This extrapolated value (Table 2) represents the in situ, predicted maximal distance that bacterial cells can be separated from one another and still influence their neighbor’s ability to congregate locally into microcolony aggregates within the defined spatial domain. This range of influence exceeds the maximal distance found between neighboring cells in the image (13.14 μm), providing a statistically-defendable appraisal of the significant intensity of autocorrelated cell-cell interactions resulting in their aggregated colonization behavior.

Figure 3: Geostatistical semivariogram of the spatial autocorrelation of the CMEIAS cluster index for cells of R. leguminosarum bv. trifolii E11 in the rhizoplane landscape image.
Biofilm landscapes commonly have complex architectures that exhibit self-similar fractal geometry [6-8,38]. This type of spatial pattern often arises from the scale-dependent, heterogeneous fractal variability in limiting resource partitioning within their distribution networks, and reflects a high efficiency of cell positioning for optimal utilization of fractal-like apportionments in distribution of food-cluster resources, and the coexistence of multiple species among community members on a local scale [6-11]. CMEIAS analysis detected positive fractal geometry in the spatial pattern of aggregated distribution among the cells in the landscape image (Table 2), suggesting that their colonization behavior has resulted in a spatial positioning designed to exploit the fractal-like allocation and acquisition of clustered nutrient resources on the rhizoplane [6-11].
In summary, CMEIAS-based applications of bioimage informatics can fill major gaps in studies of microbial ecology by providing user-friendly computing tools that extract ecologically relevant, quantitative phenotypic information from digital images of microbes at multiple spatial scales, including their spatial ecology within biofilms. In this study, we examined the spatial distribution of a rhizobial biofertilizer strain on a sampled rhizoplane surface of rice grown in a field soil, representing an association that can ultimately lead to significant growth-promotion of the crop plant. The results of this spatial ecology analysis concur with other studies that examined the patterns of spatial distribution and biofilm colonization behavior of other microbes on other substrata [3-8,16,17], indicating that microbial patterns of spatial distribution within immature biofilms in various ecosystems are highly structured rather than deemed as randomly distributed, and the data provide abundant statistical evidence indicating that the colonization behavior of the test strain in the sampled rhizoplane landscape is dominated in situ by positive, cooperative types of regionalized cell-cell interactions with their microbial neighbors. We are exploring how this bioimage informatics approach to analyze colonization intensities and behaviors of superior inoculant strains can enhance the biofertilization technologies as a successful/promising tool for predicting, before the start of field tillage and the planned farming processes, the potential for success or failure of the biofertilization practice in promoting plant growth and crop yield under field conditions, especially when the same inoculant strain is already indigenous in the field soil used for cultivation.
Acknowledgements
Portions of CMEIAS development were supported by United States-Egypt Science and Technology Development Funds (Projects STDF ID3852 and 58-3148-1-140), Michigan State University Kellogg Biological Station Long-Term Ecological Research program, the Agriculture Research Center -Sakha Agricultural Research Station, Kafr El-Sheikh, Egypt, and Michigan AgBioResearch.
References
- Liu J, Dazzo FB, Glagoleva O, Yu B, Jain AK (2001) CMEIAS: A computer-aided system for the image analysis of bacterial morphotypes in microbial communities. Microbial Ecol 4: 173-194.
- Gross CA, Reddy C, Dazzo FB (2010) CMEIAS color segmentation: An improved computing technology to process color images for quantitative microbial ecology studies at single-cell resolution. Microbial Ecol 59: 400-414.
- Gantner S, Schmid M, Durr C, Schuhegger R, Steidle A, et al. (2006) In situ spatial scale of calling distances and population density-independent N-Acylhomoserine lactone mediated communication by rhizobacteria colonized on plant roots. Fed Eur Microbiol Societies Microbial Ecol 56: 188-194.
- Dazzo FB, Schmid M, Hartmann A (2007) In: Hurst CJ et al. (Eds), Manual of environmental microbiology. American Society for Microbiology Press 3rd edn.
- Dazzo F, Gross C (2012) CMEIAS Quadrat Maker: A digital software tool to optimize grid dimensions and produce quadrat images for landscape ecology spatial analysis. J Ecosys Ecograph 3:136. doi:10.4172/2157-7625.1000136.
- Ji Z, Card K, Dazzo FB (2015) CMEIAS JFrad: A new computing toolkit to discriminate the fractal geometry of landscape architecture and spatial patterns of individual cells in microbial biofilms. Microbial Ecol 69: 710-720.
- Dazzo FB, Klemmer KJ, Chandler R, Yanni YG (2013) In situ ecophysiology of microbial biofilm communities analyzed by CMEIAS computer-assisted microscopy at single-cell resolution. Diversity 5: 426-460.
- Dazzo FB, Sexton R, Jain A, Makhoul A, Shears M, et al. (2017) Influence of substratum hydrophobicity on the geomicrobiology of river biofilm architecture and ecology analyzed by CMEIAS bioimage informatics. Geosciences 7(3) 56.
- Ritchie ME (2010) Scale, heterogeneity, and the structure and diversity of ecological communities; Princeton University Press.
- Scheuring I, Riedi RH (1994) Applications of multifractals to the analysis of vegetation pattern. J Veg Sci 5: 489-495.
- West G, Brown J, Enquist B (1999) The fourth dimension of life: fractal geometry and allometric scaling of organisms. Sci 284: 1677-1679.
- Dale M, Fortin MJ (2014) Spatial analysis: a guide for ecologists. Cambridge University Press, Cambridge, USA.
- Nadell, CD, Drescher, K, Foster KR (2016) Spatial structure, cooperation and competition in biofilms. Nat. Rev. Microbiol. 14: 589-600.
- Gao M, Zheng H, Ren Y, Lou R, Wu F, et al. (2016) A crucial role for spatial distribution in bacterial quorum sensing. Sci Rep 6: 34695.
- Legendre P, Legendre L (2012) Numerical ecology. Elsevier, Amsterdam, USA.
- Dazzo FB, Niccum BC (2015) Use of CMEIAS image analysis software to accurately compute attributes of cell size, morphology, spatial aggregation and color segmentation that signify in situ ecophysiological adaptations in microbial biofilm communities. Computation 3: 72-98.
- Dazzo FB, Joseph AR, Gomaa AB, Yanni YG, Robertson GP (2003) Quantitative indices for the autecological biogeography of a Rhizobium endophyte of rice at macro and micro spatial scales. Symbiosis 35: 147-158.
- Hill MO (1973) The intensity of spatial pattern in plant communities. Journal of Ecology 61: 225-235.
- Milne BT (1992) Spatial aggregation and neutral models in fractal landscapes. The American Naturalist 139: 32-57.
- Yanni YG, Rizk RY, Corish V, Squartini A, Ninke K, et al. (1997) Natural endophytic association between Rhizobium leguminosarum bv. trifolii and rice roots and assessment of its potential to promote rice growth. Plant Soil 194: 99-114.
- Yanni YG, Rizk RY, Abd El-Fattah FK, Squartini A, Corich V, et al. (2001) The beneficial plant growth-promoting association of Rhizobium leguminosarum bv. trifolii with rice roots. Aust J Plant Phys 28: 845-870.
- Yanni YG, Dazzo FB (2010) Enhancement of rice production using endophytic strains of Rhizobium leguminosarum bv. trifolii in extensive field inoculation trials within the Egypt Nile delta. Plant Soil 336: 129-142.
- Hammer O, Harper, DAT, Ryan PD (2001) PAST: Paleontological statistics software package for education and data analysis. Palaeontol Electronica 4: 1-9.
- Krebs CJ (1999) Ecological methodology. Benjamin Cummings Publishers, San Francisco, USA.
- Magurran AE (2004) Measuring biological diversity. Blackwell Press, Malden, USA.
- Holmquist L, Kjelleberg S (1993) Changes in viability, respiratory activity, and morphology of the marine Vibrio sp. strain S14 during starvation of individual nutrients and subsequent recovery. FEMS Microbial Ecol 12: 215-224.
- Hahn MW, Moore ER, Hofle MG (1999) Bacterial filament formation, a defense mechanism against flagellate grazing, is growth rate controlled in bacteria of different phyla. Appl. Environ. Microbiol 65: 25-35.
- Holgate P (1965) Some new tests of randomness. J Ecol 3: 261-266.
- Hopkins B, Skellum JG (1954) A new method for determining the type of distribution of plant individuals. Ann Bot. New Series 18: 213-227.
- Clark PJ, Evans FC (1954) Distance to nearest neighbor as a measure of spatial relationships in populations J Ecol 35: 445-453.
- Davis JC (1986) Statistics and data analysis in geology. John Wiley & Sons, New York, USA.
- Hammer O (2009) New statistical methods for detecting point alignments. Comput Geosci35: 659-666.
- Ripley BD (1979) Tests of 'randomness' for spatial point patterns. J R Stat Soc Series 41: 368-374.
- Morisita M (1962) Iδ-index, a measure of dispersion of individuals. Res Popul Ecol 4: 1-7.
- Smith-Gill SJ (1975) Cytophysiological basis of disruptive pigmentary patterns in the leopard frog, Rana pipiens. II. Wild type and mutant cell specific patterns. J Morphol 146: 35-54.
- Robertson GP (1987) Geostatistics in ecology: interpolating with known variance. Ecology 68: 744-748.
- Ettema CH, Wardle DH (2002) Spatial soil ecology. Trends Ecol Evolut 17: 177-183.
- Hermanowicz S, Schindler U, Wilderer P (1995) Fractal structure of biofilms: new tools for investigation of morphology. Water Science and Technology 32: 99–105.