Research Article, Geoinfor Geostat An Overview Vol: 11 Issue: 1
Web GIS Based Decision Support System for Agriculture Monitoring and Management
Shashikant Patel*, Baljit Kaur, Sonam Verma, Anil Sood, Pradeep Kumar Litoria and Brijendra Pateriya
Department of Agriculture, Punjab Agricultural University, Punjab, India
*Corresponding Author: Shashikant Patel
Department of Agriculture, Punjab Agricultural University, Punjab, India
E-mail: shashikant.p@prsc.gov.in
Received date: 22 January, 2022, Manuscript No. GIGS-22-75484;
Editor assigned date: 24 January, 2022, PreQC No. GIGS-22-75484 (PQ);
Reviewed date: 14 February, 2022, QC No. GIGS-22-75484;
Revised date: 21 February, 2022, Manuscript No. GIGS-22-75484 (R);
Published date: 28 February, 2023, DOI: 10.4172/2327-4581.1000313
Citation: Patel S, Kaur B, Verma S, Sood A, Litoria PK, et al. (2023) Web GIS Based Decision Support System for Agriculture Monitoring and Management. Geoinfor Geostat: An Overview 11:1
Abstract
Agriculture plays an important role in the economic and societal development of any country. In today’s world, internet and open source technologies are changing the access and transmission of spatial data, applications, visualizations and disseminations. Recent developments in web GIS technology are featured with the GIS and internet functionality. The present study describes the design and development of a web based Agricultural Monitoring and Management System (AMMS) for the main crops of Punjab state, India. The platform is designed and developed by combining open source technologies apache server, geoserver, open layers and postgre SQL (with post GIS extension). JavaScript libraries and open layers are implemented to serve geospatial services as client. A user friendly interactive interface has been developed to visualize and analyses the seasonal and inter seasonal spatial variability and statistical summary for the entire state. The key features of the developed system are the availability of agricultural information for Punjab state for a decision making process. A decision support system which includes the crops type and statistics of cultivated area under various crops along with the satellite derived agro-meteorological parameters. Developed AMMS facilitates the users to analyses the spatio-temporal information pertaining to crop types, cultivated area, crop conditions, meteorological sub divisions and warehouses locations etc. to disseminate the information among various users and decision makers.
Keywords: Web GIS; Open source; Remote sensing; Decision support system; Geoserver; Postgres
Introduction
India is an agrarian country and agriculture is the major contributor in the development of economy and social living [1]. Agriculture is the backbone of Indian economy, contributing about 40% towards growth and development and providing livelihood to about 70% of the population [2]. Thus, for a primarily agriculture country like India, needs exact and ideal information on the sorts of yields production and their growth conditions which are essential for strengthening, monitoring and management of agricultural information in the country. Therefore, crop monitoring and management practices are important issues for decision makers to take timely necessary actions based on the conditions and parameters for the specific region.
Rapid advancements in Remote Sensing (RS) and Geographical Information System (GIS) are frequently used for weather conditions analysis and estimation and crop monitoring [3-5]. Remote sensing technology offers synoptic and frequent real time coverage for a geographical region with capabilities to gather information on a number of spatial and temporal scales; making it extremely beneficial for monitoring crop growth with respect to the crop health and crop type at regional level to provide early warnings of the adverse conditions. Remotely sensed satellite data offers significant advantages and a primary source of monitoring vegetation condition as the temporal and spatial evolution of crop growth. The use of spatial data base generated through the high resolution satellite imagery as input dataset for the web application [6,7]. Remote sensing technology has already demonstrated its ability to provide useful information on natural resources mapping and monitoring at daily scale, including crops, land use, soils, forests, etc. [8-10]. The role of remote sensing and GIS can be broadly categorized into two groups inventorying/mapping and management in agricultural applications. Geographic information system and remote sensing have gained wide importance among administrators, researchers and scientists in decision making processes [11-14]. The possibilities of interactive query systems, analysis and visualization of spatial datasets and capabilities to integrate with non-spatial database systems have broadened the scope of GIS in many decision making processes. Web based GIS is a topic of growing interest and is highly beneficial for many applications such as forestry, aquaculture, road network, urban planning, disaster management, environment monitoring, utility management and agriculture [15-20]. Various GIS based SDSSs are developed for many other applications like planning urban transportation, planning transportation of forest products, rural health care and related services, resource analysis and design [21-23]. The Web Geographic Information System (WebGIS), is a web technology to distribute the geospatial information amongst the user community via WWW [24-26]. It provides the functionality to query, download and overlay raster and vector dataset to carry out multi-scale and multi-temporal analyses. Its architecture consists of hardware parts (web server), numerous software components (operating system, Web browsers, programming languages, geospatial Database Management System (DBMS) software and procedures (generally developed using function libraries). The development and availability of powerful GIS and visualization tools in conjunction with the internet have played an important role in the emergence of web enabled Monitoring and Management Systems (MMS). The agriculture sector will benefit greatly from Information and Communication Technology (ICT) in developing countries like India, due to increasing awareness about ICT among the users. The opportunity for the use of web technology and spatial science in agricultural mapping and monitoring will improve the decision making process in particular at the time of disaster and policy framing.
Materials and Methods
Technology has changed in the approaches for developing geospatial solutions in the last few years. Scientific and technical communities are evolving away from monolithic, proprietary software solutions and adopting modular, open source software based applications that tend to serve a larger range of platforms and operating systems.
As a cost effective and quicker approach to distribute geospatial information, an open source web GIS has gained popularity among the users and geospatial community. It does not require users to invest in software resources. To utilize open source GIS solutions, we conceptualized an approach for developing a web-based GIS application, using Free and Open Source Software (FOSS). All Free Open Source Software (FOSS) are equipped with free licenses and an open structure that users can adapt to their own needs, which makes this platform an extremely versatile and high performing solution if compared to those provided by other competitors within the market [27]. Some of the proprietary platforms available in industry, such as Environmental Systems Research Institute (ESRI, Redlands, CA, USA), geomedia Web Map, IGiS (Scanpoint Geomatics Limited, Ahmedabad, India) etc. Alternatively, open source tools have been used for the development of AMMS. The development and availability of powerful Geographic Information System (GIS) and its visualization with the internet has played an important role in development of web based agricultural monitoring and management system. The dissemination of agricultural information along with the vegetation indices to the farmers, researchers, policy makers would be of great help in monitoring and management of agricultural resources.
The developed application is cost effective as it is developed on open source platform which requires no commercial licence. It is easy to enforce and information sharing is free of charge. This web GIS application provides a faster mechanism to share agricultural information among farmers, decision makers and policy makers. The interactive web user interface is built using the HTML and CSS frameworks with the open layers libraries which are used as a main map client. Finally, a dynamic Styled Layer Descriptor (SLD) is generated with the user friendly Desktop Internet GIS (uDig) open source software and has been incorporated for creating interactive and user oriented styling of maps. In addition, the incorporation of statistical and spatial analytical modules in developed AMMS makes it a complete WebGIS system. The Web GIS system has an interactive and user friendly interface allowing users to interact with the geospatial data and application. The web GIS based AMMS solution can fill the gap by centralizing all components in one system by using open source software.
Objectives
An attempt has been made to design and develop a near real time web based solution for crop monitoring, crop management and spatio temporal analysis of crop conditions using remote sensing, GIS and open source technologies for entire Punjab state, India.
The objective of the study is to develop an interactive and dynamic WebGIS based SDSS for agriculture monitoring and management. The main aim is to develop a system for crop monitoring with analysis using vegetation indices like Normalised Difference Vegetation Index (NDVI) and Enhanced Vegetation Index (EVI) over the years to support in decision making process. To develop a time series analysis modules for the statistical analysis over the years for specified pixel location using satellite dataset.
Study area
Punjab state of India is well-known for its agricultural activities and plantations. Agricultural activities have occupied a high percentage of land in Punjab. The main sources of irrigation in Punjab are canals and tube wells. Punjab is northern state of India, surrounded by the Indian union territory of Jammu and Kashmir to the north and Indian states of Himachal Pradesh to the east, Haryana to the south and southeast and Rajasthan to the southwest. It is bordered by the Pakistani province of Punjab to the west. The state covers an area of 50,362 square kilometers, 1.53% of India's total geographical area. Punjab is the 16th largest state in size, containing 23 districts. The five tributaries of the Indus River, from which the region took its name, are Sutlej, Ravi, Beas, Chenab and Jhelum. The two major crops cultivated in Punjab are Kharif and Rabi. The Kharif crops of Punjab comprise of maize, cotton, rice, sugarcane, pulses (excluding gram), bajra, peas, jowar and vegetables such as gourd, onions, chillies etc. The Rabi crops of Punjab include gram, barley, wheat, fodder crops, potatoes, oil seeds and winter vegetables.
The agriculture in Punjab is extremely intensive in terms of land, assets, energy, nutrients, agricultural components, water and so on. Figure 1 shows the geographical location of the study area and the district boundaries of Punjab state (India).

Figure 1: District boundaries of Punjab.
Data sets
The AMMS is developed based on variety of spatial dataset. An integrated approach is followed with the help of agricultural science, spatial science and information technology. The Moderate Resolution Imaging Spectroradiometer (MODIS) vegetation indices produced on 16 day intervals at various spatial resolutions. The MODIS dataset has been downloaded from the NASA web portal vegetation indices are derived from atmospherically corrected reflectance in the red, near infrared and blue wavebands the Normalized Difference Vegetation Index (NDVI), which provides time series information of vegetation condition and the EVI, which minimizes canopy soil variations and improves sensitivity over dense vegetation conditions. The two products more effectively characterize the global range of vegetation states and processes. The spatial dataset including Remote Sensing (RS) images (MODIS-NDVI and MODIS-EVI) and classified crop type information in vector formats are pre-processed along with overlay analysis for the type and area computation using various free and open source GIS software. NDVI values are represented as a ratio ranging from -1.0 to 1.0, but in practice extreme negative values represents water feature on the surface. Values around zero represent bare soil and values over 0.3 represents green vegetation. The spatial database also comprises of administrative boundaries of Punjab (district, block and village) along with agro climatic zones, agro ecological zones, micronutrients, Krishi Vigyan kendra and warehouses.
The crop type information retrieved from remote sensing about the crops being cultivated in 23 districts of the Punjab. The data has been classified and categorized in various crop type for the specific cropping season. The spatial overlay operation has been performed to get the area statistics of the crop type for given spatial jurisdiction. This data demonstrates the crop production all over the Punjab in three different seasons, viz. Rabi, Kharif and Zaid.
Methodology of the research work has been primarily categorized in two stages design of system architecture and tools and technologies used in the development of AMMS.
System architecture of web GIS based AMMS
The system architecture of web GIS based AMMS Figure 2 consists of 3 tiers (i.e. client tier, web tier and server tier). The client tier is Web users interface. In the client tier, users make requests through a web based Graphical User Interface (GUI) from the. The user interface is defined in the presentation layer or client tier where the user and the functions communicate to each other. User sends the request and system returns the desired output as responses. As demonstrated in Figure 2. The system architecture represents the process of data archival and pre-processing of spatial dataset, spatial data management in centralized RDBMS, spatial data published as services to render over the web portal via internet using GIS server (Geoserver) and the end users accessing the spatial dataset as client.
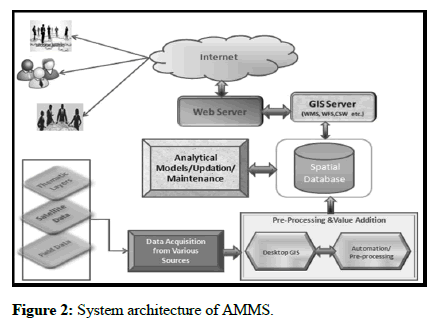
Figure 2: System architecture of AMMS.
Tools and technology
The web based system is developed using various open source software and libraries which are directly involved in the development, while many other desktop GIS applications were used for preprocessing, advanced analysis and creation of spatial database. Net Beans is an Integrated Development Environment (IDE) for Java, HTML, CSS, java script and other front end technologies has been used for development of AMMS.
Postgre SQL: Postgre SQL is an Object Relational Database Management System (ORDBMS). It is a database server for storage and transaction management. Open source database postgre SQL with post GIS extension has been used for creation of spatial database. The spatial datasets are imported in the postgre SQL and published using geo server.
Geo server: Geo server is the map server that has been used to represent the spatial data on web client. Geo Server is a Java based software server that allows users to view and edit geospatial data. Geo Server provides facilities to publish spatial data for sharing and editing using various Open Geospatial Consortium standards (OGC) services viz. Web Map Service (WMS), Web Feature Service (WFC), Web Coverage Service (WCS) etc.
Open layers: Open layers is an open source JavaScript library for showing spatial information in web browsers and provides an API for building rich web based geographic applications. It can show map tiles, vector information and markers from various sources. A Styles Layer Descriptor (SLD) is an XML based markup language that allow user defined symbolization of map layers. For a better representation of spatial data, SLD is designed in an effective and efficient manner using open source user friendly Desktop internet GIS (uDig) software.
High charts: Is an open source tool for chart and profile rendering libraries which are downloaded. It makes easy to add interactive charts to web and mobile applications. It has dynamic fitting the chart to the dimensions of its container and also places non-graph elements such as labels, legends and headings in the most optimal location automatically.
Apache: Tomcat is the web server that has been used to deploy the application. The apache tomcat software is an open source implementation of the Java servlet, Java server pages, Java expression language and Java web socket technologies.
Technical implementation
Technical implementation of the system has been described to understand the technological development and configuration of the complete system including database, web portal, GIS server and web server of the AMMS.
Pre-processing and format conversion has been applied in all vector dataset to maintain uniformity and ingested in centralized database. Metadata standards have been formulated according to the requirement for data integrity and maintain the uniformity. Preprocessing involves the spatial overlay analysis where each crop polygon joined with the political boundary viz. district name, block name and village name etc. Satellite derived indices have been preprocessed like data type conversion using scale factor, subset/clip based on the study area and imported into the postgre SQL database using “rastertopg sql” command. The raster dataset (NDVI and EVI) has been used to generate time series graphs for comparative visualization and analysis. The classified crop types and area in spatial format is available from the year 2015 to 2020. The vegetation indices (NDVI and EVI) have been incorporated from the year 2002 to 2021.
Server includes web and mapping servers web server is responds to clients by receiving the request and transmitting the response or information to meet the client’s request. Apache tomcat has been used as web server in the architecture. Geo Server is used as GIS server to serve spatial data in OGC standard services (WMS, WFS and WMTS etc.).
All the raster and vector dataset has been published using Geo Server as OGC standard Web Map Service (WMS) for the client side layer rendering. Layer specific SLD has been generated and assigned to each individual layers using Geo Server. Developed application integrates the client side scripting using Open Layers libraries, HTML, CSS and JavaScript for the dynamic and interactive web application development. An open layers library provides basic GIS functionalities to the users to render and query on spatial dataset over the web.
Finally developed AMMS application is deployed in the Apache Tomcat web server to serve the application over the Internet. Apache tomcat has been configured with developed web portal and Geo Server for synchronization of the dataset.
Results and Discussion
Interface of the developed application contains map window, legend panel, GIS functions and layer panel Figure 3. Illustrates the GUI of web based agriculture monitoring and management system. The landing page contains four major sections i.e. the map panel, layer panel and accordion, legend panel and GIS functions or tool bar. Map panel comprise of district boundary of Punjab as base layer along with the facility to add other layers dynamically; in addition to the base layers and political boundaries, parametric layers can also be rendered over the map panel. Layer panel/accordions are developed to facilitate users to dynamically add/remove layers from map panel. Layers of AMMS are in various forms viz. satellite derived crop types, agroclimatic zones of Punjab state, meteorological stations and satellite derived vegetation indices Table 1. Describes the dataset integrated with AMMS, which are categorized mainly in 10 broad themes viz. political boundaries, transport layers, crop information, satellite derived vegetation indices, agro-climatic zones, agricultural ecological zones, micro nutrients, agri-met stations, Krishi Vigyan Kendra and warehouses. Political boundaries like state, district, tehsil and village etc. have been incorporated in the AMMS for the easy understanding of features location and its jurisdiction.
Dynamic legend panel has been developed to understand the color schema or semiology of the rendered layers. Classes or categories of the colors represent the value of class range as shown in the map panel. GIS tools have been incorporated to provide GIS functions to the users to perform on the fly GIS operations in selected layers; like buffer analysis, measurements, zoom to extent and query builder etc (Table 1).
Table 1: Layer incorporated in AMMS.
Query builder tool provides facility to perform spatial analysis over the web like query based on attributes of feature. Similarly buffer tool is also very helpful in gap and proximity analysis for agricultural resources and utility availability nearby or surrounding locations. Buffers can be generated dynamically over the map based on the radius entered by user from given location on the web map (Figures 3 and 4).
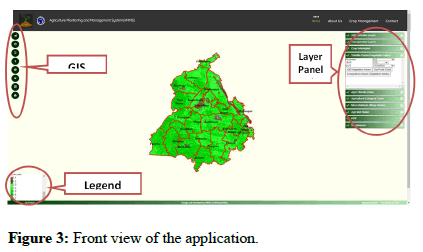
Figure 3: Front view of the application.
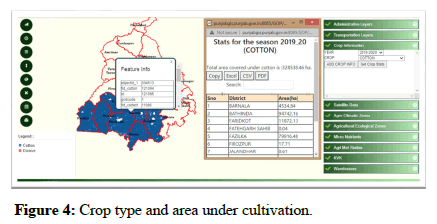
Figure 4: Crop type and area under cultivation.
Figure 4 illustrates the functionality provided in AMMS to generate crop statistics for selected crop during given cropping year/season. Statistics of the cotton crop in year 2019-2020 over Punjab has been shown in Figure 4, where the total cotton crop shown area is approximately 328538.46 hectare and district wise area of Punjab. Facility to select years and crop name dynamically has been integrated in the AMMS application. Download facility of the statistical report has been provided in various formats viz. Comma Separated Value (CSV), Portable Document Format (PDF) Microsoft Excel (MS Excel) along with copy of the table. Similarly, statistical report generation module has been developed for other major crops also, like wheat, maize, potato, rice, sugarcane, winter vegetables, zaid and happy seeders shown wheat etc.
Satellite data derived vegetation indices (NDVI and EVI) have been incorporated in the AMMS application for the continuous monitoring of the vegetation health over the study area. As illustrated in Figure 5, satellite derived indices (NDVI and EVI) are integrated from year 2003 to 2021 and the date and year can be selected dynamically by users. The times series data is for continuous monitoring and time series generation to analyses the pattern and health of crop at given location. Dynamic time series profile generation of vegetation at given location module has been developed to generate multiyear profile at given pixel using satellite derived time series data (Figure 6). Describes crop profile module for the given time frame with zoom and downloads facility in various image formats. Tabular dataset of the profile chart can be downloaded from the AMMS application as text file. Values of each node are dynamically represented on mouse hover event.
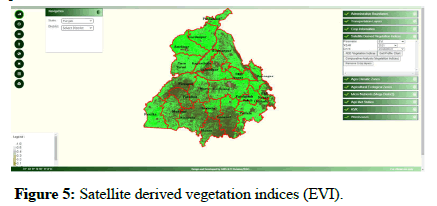
Figure 5: Satellite derived vegetation indices (EVI).
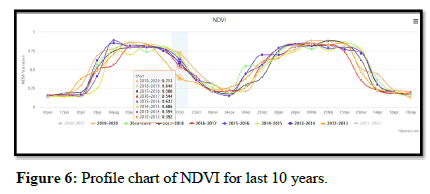
Figure 6: Profile chart of NDVI for last 10 years.
On the fly comparative analysis of vegetation indices can be performed to monitor crop health with respect to the year and season. The comparative analysis module will help to analyse the crop health with reference to the previous dates and years in single screen. Figure 7 illustrates the spatio-temporal comparative analysis module to monitor crop harvesting, growth and loss with respect to the spatio temporal variations. This module is to identify the areas where crops were harvested using the two different dates data visualization techniques in a single window. Left side image shows the EVI values as on August 20, 2020 which visually looks healthy during peak of crop; whereas, image shown in the right side represents the very low EVI values which reflects that crops were harvested as on November 08, 2020.

Figure 7: Comparative analysis module.
Conclusion
This paper presents the conceptual development architecture using open source based web GIS system for agricultural monitoring and management. The paper demonstrates the feasibility and conceptualization of information system (AMMS) which can provide valuable information to the farmers, decision makers and administrators of Punjab, India. The developed system facilitates as an effective decision making tool to planners, managers, government bodies and researchers, as it will have instant access to the latest information. This paper also presents the application of web GIS for developing spatial decision support system using open source technologies. Use of such systems can be of great interest in the field of agricultural planning and management. The GIS based AMMS portal, developed in a very simplified user interface, will help the nontechnical users to access the information and take appropriate measures to improve the crop production. These user friendly systems is developed and made simple in order to take the technology from the scientific community to the common man. It has been kept in mind that the application must be cost efficient, easy to understand, user friendly. It also highlights the use of GIS spatial data in daily life and its advantages to the agriculture sector of Punjab state for better crop management and monitoring.
The present study is an attempt to develop a web GIS based decision support system for agricultural planning and management, however, there is scope for future advancement in the system capabilities by adding result oriented satellite derived indices, thematic interactive maps, parameters which have supporting roles in agricultural development and by enhancing spatial and temporal resolution. The developed system is aimed to provide the spatial information to researchers, decision maker, planners, public and private organizations, communities, as well as simple and nontechnical users, for the better understanding of the agricultural conditions and practices over the Punjab state.
Acknowledgement
The authors would like to express their heartiest thanks to the Agriculture and Crop Modeling division (ACM) for the data processing. Authors are also thankful to geology, water resource, geoinformatics and IT (GWG and IT) division, Punjab remote sensing centre for providing all the necessary resources and infrastructures for the development of the complete system.
Conflict of Interest
The authors declare that they have no conflict of interest.
References
- Jorgenson DW (1969) The role of agriculture in economic development: Classical versus neoclassical models of growth. Subsistence Agric Economic Develop 28. [Google Scholar]
- Navalgund RR, Parihar JS, Rao PP (2000) Crop inventory using remotely sensed data. Indian J Agric Econ 55:96-109. [Google Scholar]
- Huang Y, Chen ZX, Tao YU, Huang XZ, Gu XF (2018) Agricultural remote sensing big data: Management and applications. J Integr Agric 17:1915-1931. [Crossref] [Google Scholar]
- Singh RB (2009) Remote sensing and geographical information system. New Delhi. [Google Scholar]
- Kingra PK, Majumder D, Singh SP (2016) Application of remote sensing and GIS in agriculture and natural resource management under changing climatic conditions. Agric Res J 53:295-302. [Google Scholar]
- Kumar SK, Babu SDB (2016) A Web GIS based decision support system for agriculture crop monitoring system-A case study from part of medak district. J Remote Sensing and GIS 5:177-197. [Google Scholar]
- Seth SM, Jain SK, Jain MK (1999) Remote Sensing and GIS application studies at national institute of hydrology. [Google Scholar]
- Chaudhary BS, Saroha GP, Yadav M (2008) Human induced land use/land cover changes in northern part of Gurgaon district, Haryana, India: Natural resources census concept. J Hum Ecol 23:243-252. [Crossref] [Google Scholar]
- Siddiqui MN, Jamil Z, Afsar J (2004) Monitoring changes in riverine forests of Sindh-Pakistan using remote sensing and GIS techniques. Adv Space Res 33:333-337. [Crossref] [Google Scholar]
- Goodchild MF (2010) Twenty Years of Progress: GIS science in 2010. J Spat Inf Sci 1:3-20. [Google Scholar]
- Patel S, Khopkar P, Mishra S, Sharma SA, Chaudhary K, et al. (2016) Web GIS based Vegetation Monitoring System (WGVMS). Technical Report: Space Applications Centre (SAC-ISRO).
- Ajwaliya RJ, Patel S, Sharma SA (2017) Web-GIS based application for utility management system. J Geomat 11:86-97. [Google Scholar]
- Patel S, Singh A, Litoria PK, Sood A, Kaur S, et al. (2021) Development of a crop residue burning information and management system using geo-spatial technologies. J Geomat 15. [Google Scholar]
- Hong Phuong N, Ta Nam N, The Truyen P (2018) Development of a Web-GIS based decision support system for earthquake warning service in Vietnam. J Earth Sci 40:193-206. [Crossref] [Google Scholar]
- Patel S, Joshi JP, Bhatt B (2017) An assessment of spatio-temporal variability of land surface temperature using MODIS data: A case study of Gujarat State, India. Geogr Compass 11:e12312. [Crossref] [Google Scholar]
- Ranade P, Mishra A (2015) WebGIS based Livestock Information Management System (WGLIMS): Review of Indian scenario. Int J Appl Sci Eng Technol Res 4. [Google Scholar]
- Otieno EO, Ngigi MM (2014) Web based public transport management system: A prototype PSV tracking system for Nairobi city. Int J Sci Res 3:922-926. [Google Scholar]
- Baucic M, Medak D (2015) Web GIS for airport emergency response-UML model. Promet Traffic Transport 27:155-164. [Crossref] [Google Scholar]
- Mansourian A, Taleai M, Fasihi A (2011) A web-based spatial decision support system to enhance public participation in urban planning processes. J Spat Sci 56:269-282. [Crossref] [Google Scholar]
- Sivrikaya A, Baskent EZ, Sevik U, Akgul C, Kadiogullari AI, et al. (2010) A GIS based decision support system for forest management plans in turkey. Environ Eng Manag J 9:929-937. [Google Scholar]
- Arampatzis G, Kiranoudis CT, Scaloubacas P, Assimacopoulos D (2004) A GIS based decision support system for planning urban transportation policies. Eur J Oper Res 152:465-475. [Crossref] [Google Scholar]
- Akay AE, Suslu HE (2017) Developing GIS based decision support system for planning transportation of forest products. J Inno Sci Eng 1:6-16. [Google Scholar]
- Huang Y (2009) GIS based Decision Support Systems (DSS) for resources analysis and design. 2009 International Conference on Computational Intelligence and Software Engineering. 1-4. [Crossref] [Google Scholar]
- Alesheikh AA, Helali H, Behroz HA (2002) Web GIS: Technologies and its applications in symposium on geospatial theory, processing and applications; ISPRS: Ottawa, ON, Canada. [Google Scholar]
- Kitslou D, Nittis T, Tsaknakis A, Esteve-Selma MA, Falcao M, et al. (2006) Development of a web GIS application for supporting the management of Southern european coastal lagoons. 12-16. [Google Scholar]
- Soto-Garcia M, Del-Amor-Saavedra P, Martin-Gorriz B, Martínez-Alvarez V (2013) The role of information and communication technologies in the modernisation of water user associations’ management. Comput Electron Agric 98:121-130. [Crossref] [Google Scholar]
- Kitsiou D, Patera A, Tsegas G, Nitis TA (2021) WebGIS Application to Assess Seawater Quality: A case study in a coastal area in the Northern Aegean Sea. J Mar Sci Eng 9:33. [Crossref] [Google Scholar]
 Spanish
  Chinese
  Russian
  German
  French
  Japanese
  Portuguese
  Hindi
Hindi 
