Spanish
  Chinese
  Russian
  German
  French
  Japanese
  Portuguese
  Hindi
Hindi Research Article, Res J Opt Photonics Vol: 1 Issue: 1
Subtractive Imaging Using Gaussian Fits and Image Moments in Confocal Microscopy
Xianjun Ye1,2 and Matthew D McCluskey1*
1Department of Physics and Astronomy, Washington State University, Pullman, WA 99164-2814, USA
2Department of Anatomy and Structural Biology, Gruss Lipper Biophotonics Center, Albert Einstein College of Medicine, Bronx, NY 10461, USA
*Corresponding Author : Matthew D McCluskey, PhD
Department of Physics and Astronomy, Washington State University, Pullman, WA 99164-2814, USA
Tel: +1 (509) 335-5356
E-mail: mattmcc@wsu.edu
Received: October 16, 2017 Accepted: October 23, 2017 Published: October 27, 2017
Citation: Ye X, McCluskey MD (2017) Subtractive Imaging Using Gaussian Fits and Image Moments in Confocal Microscopy. Res J Opt Photonics 1:1.
Abstract
A subtractive imaging method is described that uses Gaussian fits and image moments in the CCD confocal microscopy configuration. Subtraction of the 0th order image moment of a digital pinhole filtered signal from the Gaussian fitted intensity signal reveals missing details of a high resolution test target. By choosing an appropriate weighting coefficient, the associated halo effect can be removed while retaining the fine details.
Keywords: Confocal microscopy; Image processing; Gaussian fits; Image moments
Introduction
Subtractive imaging has been shown to provide resolution enhancement to confocal microscopy [1]. Earlier studies mostly involve the use of subtraction between confocal signals taken at different pinhole settings in a point detection configuration [2-5]. The two confocal signals can either be acquired simultaneously by using two different pinholes and detectors [2,3,5] or successively by a single detector at different pinhole settings [4]. For the simultaneous acquisition case, accurate alignment of the two pinholes in both axial and transverse directions is crucial to the degree of performance [2]. For the successive acquisition case, a precise image registration was necessary for correcting any misalignment caused by time drifts of experimental conditions [4]. Recently, the development of optical super-resolution has revived the interest in subtractive imaging. Sánchez-Ortiga et al. showed a scheme of subtractive-imaging confocal microscopy using a CCD camera as a detector [6]. Hao et al. showed that finer details in a fixed cell sample can be revealed by subtracting a suitably weighted short lifetime intensity-image from a long life one in time-gated stimulated emission depletion (STED) microscopy [7].
Despite the differences in experimental realizations, most of the subtractive-imaging confocal microscopy studies can be described by a common mathematical expression.
![]() (1)
(1)
where I closed refers to closed-pinhole (size smaller than the Airy disk diameter) intensity and I open refers to open-pinhole intensity. γ is a weighting coefficient. The final performance of subtraction depends heavily on the choice of γ, which is usually obtained through trial and error. The performance enhancement brought up by subtractive imaging can be explained using the unsharp mask filtering technique originally developed for astrophotography [2,8]. The closed-pinhole image contains more high frequency spatial components, which correspond to sharp features in an image. The open-pinhole image is blurred by the enclosure of more low frequency spatial components which corresponds to the fuzziness of an image. Subtraction of the open-pinhole image from the closed-pinhole image removes or reduces low frequency spatial information, leading to an enhancement of high frequency spatial information and sharpening of the image. However, this subtraction can cause over-shoots and under-shoots in areas of sharp edges, leading to halo effects around these areas [9].
In a previous study, we showed that image moment analysis of properly cropped wide field CCD images of signal light profile in the CCD confocal microscopy configuration can yield an equivalent performance as fiber-optic confocal microscopy [10]. In this work, we introduce a subtractive imaging scheme which uses two-dimensional Gaussian fits and image moment analysis to enhance resolution and reduce halo effects.
Experiment
Figure 1 shows the optical setup of the experiment. A collimated laser beam of 4.5 mW at 532 nm wavelength was expanded by a 2x Keplerian type beam expander to slightly overfill the back aperture of the microscope objective O1 (Zeiss LD Plan-Neofluor 20x/0.4 Corr). A 50 μm diameter pinhole spatial filter was inserted at the confocal point of the beam expander. A Glan-Taylor polarizer and a half waveplate were used for beam attenuation. The reflected light was collected by a 1000 mm effective focal length telephoto tube lens which is formed by a 200 mm positive achromatic doublet (Thorlabs, AC254-200-A) and a 25 mm negative achromatic doublet (Thorlabs, ACN127-025-A), and then focused onto a monochrome camera CCD1 (The Imaging Source, DMK 23U618) for primary signal detection. A laser line filter at 532 nm (Thorlabs, FL532-10) keeps ambient light from entering CCD1, only allowing reflected laser light to pass through. A portion of the reflected light signal was directed by a cubic beam splitter and coupled into a 10 μm core multimode fiber (Thorlabs, M65L02) by a 4x microscope objective O2 (Thorlabs, RMS4X) for secondary signal detection. This fiber-optic arm acts as a reference confocal microscope for comparison. A color camera CCD2 (The Imaging Source, DMK 23U274) behind a 200 mm focal length tube lens (Thorlabs, LBF254-200-A) was used for alignment and inspection. A notch filter at 532 nm (Thorlabs, NF533-17) keeps laser light from entering CCD2. A white light LED was used for illumination (not shown). Scanning was achieved by using a piezoelectric objective scanner (Physik Instrumente, PIFOC® P-725.4CD) for axial scan (Z) and a piezoelectric nanopositioning stage (Physik Instrumente, P-611.2S) for lateral scan (XY).

Figure 1: Experimental setup (not drawn to scale).
BE: Beam Expander; BS: Beam Splitter; L1: Telephoto Tube Lens; L2: Singlet Tube Lens; LF: Laser Line Filter; MMF: Multimode Fiber; NF: Notch Filter; O1, O2: Microscope Objective; PD: Photodiode; PH: Pinhole; PL: Polarizer; PZT: Piezo Stage; λ/2: Half Waveplate
In such an optical setup, the Airy disk diameter (1 AU) in the focal plane of the 20x/0.4 Zeiss microscope objective is 1.62 μm at 532 nm, which corresponds to an area of 35x35 pixel on the monochrome CCD, and a circular area of 8.9 μm diameter on the fiber facet. Thus, the 10 μm diameter fiber core is compared to a 40x40 pixel collection area on the CCD, and we choose this digital pinhole setting for all our following experiments.
A general form of (i+j)th order image moment in image processing is given by [11]:
![]() (2)
(2)
where the 0th order image moment M00 is equivalent to the irradiance. The equation describing the Gaussian is:
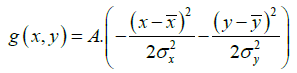 (3)
(3)
where A is the fitted peak intensity at beam center. The initial estimates for the five Gaussian parameters were derived from image moment analysis.
The subtraction operation is then given by
![]() (4)
(4)
where normalization is given by 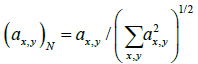 and C is a weighting coefficient. The extra square operation is used to keep result positive.
Results and Discussion
To demonstrate the performance of our proposed method, we started with a two-dimensional scan of a USAF resolution target (Ready Optics, California, up to Group 11, Element 6). Figure 2 shows a scan of a 10 μm × 10 μm area in Group 10 at a 0.02 μm step size along both X and Y. Figure 2a is the direct intensity map from fiber-optic confocal arm. Figure 2b is the reconstructed image using 0th order image moment M00 of a 40 × 40 pixel area which encloses the whole beam profile. Figure 2c is the peak intensity map derived from Gaussian fitting the same 40 × 40 pixel region of interest (ROI). A slight improvement of contrast can be seen from Figures 2a-2c. By subtracting Figure 2b from Figure 2c using Equation 4 with C=1, an immediate resolution enhancement is obtained, shown in Figure 2d. The missing number profiles of “2” and “3” in Figures 2a-2c are brought up by this subtraction operation. However, this resolution enhancement is also accompanied by a halo effect around those enhanced sharp edges (in other texts, this is referred to as negative intensity values [4,6]). Figure 3 shows line profiles at x=6 μm and x=8.12 μm. The brought-up number profiles are shown in Figure 3b as two three-peak groups inside each number. The direct subtraction (green line, color online) causes spurious spikes at each transition location. To eliminate this halo effect, we tweak the weighting coefficient C and we found that the optimal value of C is given by the median value of the scaling matrix (A)N/(M00)N. Figure 2e shows the final image with C=0.81. As shown in Figure 3 (blue line, color online), this halo effect is almost completely removed while the desired resolution enhancement remains.

Figure 2a: Images of a high resolution test target (Group 10, Elements 2 and 3). (a) Fiber-optic confocal. (b) 0th order image moment. (c) Gaussian fitted intensity. (d) Subtraction of (b) from (c). (e) Weighted subtraction of (b) from (c).

Figure 2b: Images of a high resolution test target (Group 10, Elements 2 and 3). (a) Fiber-optic confocal. (b) 0th order image moment. (c) Gaussian fitted intensity. (d) Subtraction of (b) from (c). (e) Weighted subtraction of (b) from (c).

Figure 2c: Images of a high resolution test target (Group 10, Elements 2 and 3). (a) Fiber-optic confocal. (b) 0th order image moment. (c) Gaussian fitted intensity. (d) Subtraction of (b) from (c). (e) Weighted subtraction of (b) from (c).

Figure 2d: Images of a high resolution test target (Group 10, Elements 2 and 3). (a) Fiber-optic confocal. (b) 0th order image moment. (c) Gaussian fitted intensity. (d) Subtraction of (b) from (c). (e) Weighted subtraction of (b) from (c).

Figure 2e: Images of a high resolution test target (Group 10, Elements 2 and 3). (a) Fiber-optic confocal. (b) 0th order image moment. (c) Gaussian fitted intensity. (d) Subtraction of (b) from (c). (e) Weighted subtraction of (b) from (c).
In Figures 3a and 3b, we determined the line width for Group 10, Element 2 is 0.445 ± 0.019 μm (the designed value is 0.435 μm) and that for Element 3 is 0.370 ± 0.035 μm (the designed value is 0.388 μm). These numbers translate into adjacent line spacing of 0.89 μm and 0.74 μm which are right around the diffraction limit of our 20x/0.4 microscope objective, 0.81 μm.

Figure 3a: Line profiles of intensity. (a) x=6 μm (b) x=8.12 μm.

Figure 3b: Line profiles of intensity. (a) x=6 μm (b) x=8.12 μm.
In another extreme test, we scanned a piece of GaP sample which consists of equally spaced micro-pillar structure fabricated on GaP substrate. The GaP micro-pillar is covered with a layer of HSQ photoresist. The presence of HSQ photoresist requires the use of low voltage and low vacuum operating condition in SEM measurement to avoid charging effect. The SEM image (Figure 4d) shows that the spacing between adjacent GaP pillars is about 1.5 μm and the diameter of the pillar is about 500 nm. Figures 4a-4c shows the confocal images. The confocal scan area is 5 μm × 5 μm and the step size is 0.01 μm in both X and Y. Figure 4e shows the weighted subtraction resultant image with the median value of the scaling matrix equal to 1. The donut shape of the confocal images is the result of difference in optical properties between HSQ photoresist and GaP substrate. The refractive index value of GaP is about 3.5 at 532 nm wavelength [12] and that of HSQ is constant at 1.4 from 400 nm to 800 nm [13]. Thus, GaP is 10 times more reflective than HSQ, which creates a hollow center in the optical images. Despite the asymmetric distortion caused by the increased influence of system drift and environmental fluctuations in this scan resolution, a vertical line profile of the center column gives a lower bound pillar width estimate of 336 ± 18 nm (full-width-halfmaximum or FWHM) or 448 ± 8 nm (1/e), which is on the same length scale of the SEM.

Figure 4a: Images of a GaP micro-pillar sample. (a) Fiber-optic confocal. (b) 0^{th} order image moment M_{00}. (c) Gaussian fitted intensity. (d) SEM image, scale bar=1 μm. (e) Weighted subtraction of (b) from (c), C = 1.

Figure 4b:Images of a GaP micro-pillar sample. (a) Fiber-optic confocal. (b) 0th order image moment. (c) Gaussian fitted intensity. (d) SEM image, scale bar=1 μm. (e) Weighted subtraction of (b) from (c).

Figure 4c: Images of a GaP micro-pillar sample. (a) Fiber-optic confocal. (b) 0th order image moment. (c) Gaussian fitted intensity. (d) SEM image, scale bar=1 μm. (e) Weighted subtraction of (b) from (c).

Figure 4d: Images of a GaP micro-pillar sample. (a) Fiber-optic confocal. (b) 0th order image moment. (c) Gaussian fitted intensity. (d) SEM image, scale bar=1 μm. (e) Weighted subtraction of (b) from (c).

Figure 4e: Images of a GaP micro-pillar sample. (a) Fiber-optic confocal. (b) 0th order image moment. (c) Gaussian fitted intensity. (d) SEM image, scale bar=1 μm. (e) Weighted subtraction of (b) from (c).
To evaluate the optical sectioning capability of our method, we did an axial scan on a high quality mirror surface. Figure 5 shows the axial response over a 10 μm scan range at 0.1 μm scan step. A median weighted subtraction gives a FWHM value of 1.9 μm, a 1.7 fold improvement over Gaussian fits and a 2.8 fold improvement over the fiber-optic confocal case.

Figure 5: Axial response.
Conclusion
In conclusion, we have demonstrated a subtractive imaging scheme in the CCD confocal microscopy configuration using Gaussian fits and image moment analysis. 0th order image moment (M00) integrates intensity over a 40 × 40 pixel ROI, representing a median-sized pinhole signal. Gaussian fit gives the peak intensity at the center of this ROI, representing an infinitesimally closed pinhole signal. Subtraction of a median weighted M00 image from the Gaussian fitted intensity image enhances the resolution in both lateral and axial direction, and minimizes the halo effect. In our dual detector configuration, the subtraction between fiber-optic and CCD confocal signals can also provide enhancement to the final image. However, this enhancement requires high accuracy in optical alignment. Compared to other subtractive confocal imaging approaches, our method only uses a single signal source, and a fully determinable weighting coefficient which can remove/ minimize the halo effect.
Acknowledgement
The authors thank Prof. Kai-Mei Fu and Dr. Mike Gould (Department of Physics and Electrical Engineering, University of Washington) for providing the GaP sample, Drs. Valerie Lynch-Holm and Dan Mullendore (Franceschi Microscopy and Imaging Center, Washington State University) for helping with SEM setup.
Funding
National Science Foundation (NSF), Grant/Award Number: DMR-1561419.
References
- Wilson T, Hamilton DK (1984) Difference confocal scanning microscopy. Opt Acta (Lond) 31: 453-465.
- Sheppard CJR, Cogswell CJ (1990) Confocal microscopy with detector arrays. J Mod Opt 37: 267-279.
- Boyer G, Sarafis V (2001) Two pinhole super resolution using spatial filters. Optik - Int J Light Elec Opt 112: 177-179.
- Heintzmann R, Sarafis V, Munroe P, Nailon J, Hanley QS, et al. (2003) Resolution enhancement by subtraction of confocal signals taken at different pinhole sizes. Micron 34: 293-300.
- Zhao W, Tan J, Qiu L (2005) Improvement of confocal microscope performance by shaped annular beam and heterodyne confocal techniques. Optik - Int J Light Elec Opt 116: 111-117.
- Sánchez Ortiga E, Sheppard CJ, Saavedra G, Martínez-Corral M, Doblas A, et al. (2012) Subtractive imaging in confocal scanning microscopy using a CCD camera as a detector. Opt Lett 37: 1280-12802.
- Hao X, Kuang C, Gu Z, Li S, Ge J, et al. (2013) Optical super-resolution by subtraction of time-gated images. Opt Lett 38: 1001-1003
- Malin DF (1977) Unsharp masking. AAS Photo Bulletin 16: 10-13.
- Deng G (2011) A Generalized Unsharp Masking Algorithm. Trans Img Proc 20: 1249-1261.
- Ye X, McCluskey MD (2016) Modular scanning confocal microscope with digital image processing. PLoS ONE 11: e0166212.
- Hu MK (1962) Visual pattern recognition by moment invariants Information Theory. IRE Transactions on 8: 179-187.
- Aspnes DE, Studna AA (1983) Dielectric functions and optical parameters of Si, Ge, GaP, GaAs, GaSb, InP, InAs and InSb from 1.5 to 6.0 Ev. Phys Rev B 27: 985-1009.
- Lis S, Dylewicz R, My�?�?liwiec J, Miniewicz A, Patela S (2008) Application of flowable oxides in photonics. Mater Sci Poland 26: 189-194.