Research Article, Geoinfor Geostat An Overview Vol: 12 Issue: 6
Site Characterization, Seismic Hazard in Kashmir Himalaya to Northeast India: 1D/2D/3D Modeling, Microzonation and Damage Studies
Sankar Kumar Nath*, Arpita Biswas, Anand Srivastava, Jyothula Madan, Chitralekha Ghatak, Amrendra Pratap Bind and Arnab Sengupta
1Department of Geology and Geophysics, Indian Institute of Technology Kharagpur, Kharagpur, India
*Corresponding Author: Sankar Kumar Nath,
Department of Geology and Geophysics, Indian Institute of Technology Kharagpur, Kharagpur, India
E-mail: nath@gg.iitkgp.ac.in
Received date: 15 November, 2024, Manuscript No. GIGS-24-152443;
Editor Assigned date: 18 November, 2024, PreQC No. GIGS-24-152443 (PQ);
Reviewed date: 02 December, 2024, QC No. GIGS-24-152443;
Revised date: 09 December, 2024, Manuscript No. GIGS-24-152443 (R);
Published date: 16 December, 2024, DOI: 10.4172/2327-4581.1000422.
Citation: Nath SK, Biswas A, Srivastava A, Madan J, Ghatak C, et al. (2024) Site Characterization, Seismic Hazard in Kashmir Himalaya to Northeast India: 1D/2D/3D Modeling, Microzonation and Damage Studies. Geoinfor Geostat An Overview.12:6.
Abstract
Indian subcontinent, marked by its intricate seismotectonic settings stands out as the most active region in the globe. This study conducts a firm rock-compliant probabilistic seismic hazard assessment considering both tectonic and polygonal sources in 0 km- 25 km, 25 km-70 km, 70 km-180 km and 180 km-300 km depth ranges, next generation attenuation models through a logic tree framework across the tectonic ensemble from Kashmir Himalaya to Northeast India encompassing six seismogenic tectonic provinces classifying the ensemble in the 'moderate' to 'severe' hazard regime, highlighting the need for a site-specific surface-consistent investigation that shear-wave velocity characterizes the Ensemble into 11 site classes and estimates surface-consistent probabilistic seismic hazard of the ensemble in the range of 0.10 g -2.32 g for 475 years of return period using a systematic 1D/2D/3D site response analysis. Liquefaction potential and landslide susceptibility index adds secondary hazard to both geohazard and seismic hazard regime for a comprehensive seismic hazard microzonation of the important cities and urban centers in the tectonic ensemble. The damage states modelled using capacity spectrum method on prevailing building types for the surface-consistent Probabilistic Peak Ground Acceleration (PGA) by Seismic Loss Estimation using a Logic Tree Approach (SELENA) are found to be aligned with the reported damage scenarios of most prevalent reinforced concrete buildings triggered by large historical earthquakes in each of the tectonic provinces of the Ensemble.
Keywords: Surface-consistent probabilistic seismic hazard; Site classification; Microzonation; Liquefaction; Landslide susceptibility; SELENA
Introduction
The interaction of the Indian and Eurasian plates generated significant stress within the Earth's crust, leading to intermittent release of stress through earthquake triggering along the plate boundary, together with faults and lineaments within the plates. The vulnerability atlas of India indicates that over 59% of the nation's entire land cover is susceptible to seismic risk [1]. Rapid and unregulated urbanization is nationwide on the rise to accommodate the population outburst. The country has experienced recurrent damage from moderate-sized earthquakes with a magnitude of 7.0 or less, primarily due to structures not constructed in accordance with recommended building codal provisions designed to withstand the potential effect of earthquakes.
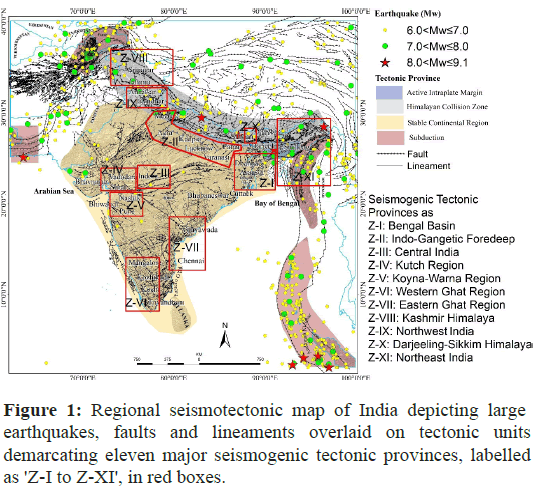
The Indian subcontinent exhibits a complex geological and tectonic configuration detailing the major lineament and fault system (Figure 1). Utilizing this information and considering the historical seismic activities, India has been divided into eleven significant seismogenic tectonic provinces, denoted as Bengal Basin (Z-I), Indo-Gangetic Foredeep (Z-II) , Central India (Z-III), Kutch (Z-IV), Koyna-Warna Region (Z-V), Western Ghats (Z-VI), Eastern Ghats (Z-VII), Kashmir Himalaya (Z-VIII), Northwest India (Z-IX), Darjeeling-Sikkim Himalaya (Z-X) and Northeast India (Z-XI) having the potential of triggering moderate to large magnitude earthquakes (Figure 1) [2].
The tectonic ensemble encompassing Kashmir Himalaya, Northwest India including Nepal, Indo-Gangetic foredeep plain, Bengal basin including Bangladesh, Darjeeling-Sikkim Himalaya, Northeast India including Bhutan, which jolted time and again by devastating earthquakes in the past, resulting in the loss of life and property. The 2005 Kashmir earthquake of MW 7.6 in Kashmir Himalaya and 1905 Kangra earthquake of MW 7.8 in Northwest India, 1934 Bihar-Nepal earthquake of MW 8.1 and 2015 Gorkha-Nepal earthquake of MW 7.8 in Nepal, 2011 Sikkim earthquake of MW 6.9 in Darjeeling-Sikkim Himalaya, 1897 Shillong earthquake of MW 8.1, and 1950 Assam earthquake of MW 8.7 in Northeast India collectively emphasizing the seismic susceptibility of this complex tectonic zones. This tectonic ensemble is characterized by several major fault systems, each playing a pivotal role in the region's seismicity. The tectonic ensemble is regarded as mega-earthquake prone zone due to its rugged topography, frail geologic base, active tectonics, high seismicity, frequent erosion and rapid channel changes. Evidently, most of the areas of this tectonic ensemble is located over thick younger alluvium, specifically Indo-Gangetic foredeep, Brahmaputra valley and Bengal basin. These areas are characterized by shallow clay, sand and silt layers that can amplify ground motion and cause liquefaction, with devastating consequences during a great earthquake.
Subsurface characteristics significantly influence the destruction during any large earthquake owing to seismic soil/ sediment amplification of a site, which primarily controls the ground shaking level. The shear-wave velocity of the soil/sediment layer predominantly impacts the site's amplification behavior, thus rendering seismic site classification and its characterization as the most rational step in understanding the soil/sediment response and quantifying site effects [3]. The tectonic ensemble has been investigated to evaluate engineering soil/sediment properties and subsurface composition using several Geophysical and geotechnical methodologies. Thereby, the effective shear-wave velocity (VS30) over the top 30 m, indicating the shallow subsurface conditions, has been used to generate seismic site classification based on the nomenclature [18-20]. Local site conditions and intensity of strong ground motion critically influence structural damage by affecting the dynamic behavior of soil/sediment layers above engineering bedrock under seismic loading, which have been captured through 1D/2D/3D site response analyses using DEEPSOIL, PLAXIS 2D and PLAXIS 3D software packages, further developing site-specific ground response spectra for engineering design. The analysis estimated site-specific surface-consistent Peak Ground Acceleration (PGA) and Pseudo Spectral Acceleration (PSA) offering a refined understanding of ground motion characteristics. Additionally, the investigation extends to address earthquake secondary hazard in terms of soil liquefaction potential and landslide susceptibility, which show a pivotal impact in increasing the seismic risk of a site in the study region. Eventually, seismic hazard microzonation of a few capital cities and urban centres have been carried out whose population is over 1 million in the tectonic ensemble along with urban structural impact assessments utilizing SELENA as implication of the seismic hazard model presented here. The integrated approach of this research aims to enhance scientific understanding of seismic behavior while offering actionable insights for engineering practices, urban planning and disaster preparedness, ultimately advancing seismic risk mitigation and fostering resilience in earthquake-prone regions.
Probabilistic seismic hazard of India and the seismogenic tectonic ensemble extending from Kashmir Himalaya to Northeast India
The basic principle underlying Probabilistic Seismic Hazard Assessment (PSHA) was initially formulated by Cornell [4] and Esteva [5] and subsequently implemented by several workers considering an algorithm which amalgamates various components of seismic hazard viz. areal polygonal and/or tectonic seismogenic source model, maximum earthquake prognosis, seismic site characteristics, absolute and spectral ground motion prediction equations etc., [6-10]. Most of the notable studies on probabilistic seismic hazard assessment of India and its surrounding region did not account for the sources based on tectonofabric like faults and lineaments in their framework. All kinds of seismogenic sources both areal and tectonic and their respective activity rates at various hypocentral depth ranges and threshold magnitudes are all integrated into the PSHA protocol (Figure S10). An in-depth seismicity analysis has been built in using a declustered, homogeneous and complete earthquake catalogue of the region. The complete earthquake catalogue of India and its neighboring region has been prepared, considering the earthquake recordings for the period 1900-2014 and is extended upto 2018 in the present study [11].
A number of local, regional and global ground motion prediction equations and next generation attenuation models with precisely defined aleatory and epistemic uncertainties corresponding to all the hazard components and their probability distributions have been embedded. Using Cornell [4], Esteva [5], and McGuire [12] logic tree framework has been developed for the entire Indian peninsula and its surrounding region that includes all the eleven tectonic provinces (Figure S10). The framework incorporated active tectonic sources such as faults and lineaments together with layered polygonal sources demarcated within depth ranges of 0 km-25 km, 25 km-70 km, 70 km-180 km and 180 km-300 km with 60% and 40% weightage through the threshold magnitudes of MW 3.5, 4.5 and 5.5 [8,13].
The contribution of background seismicity in terms of activity rate is computed employing smoothened gridded seismicity models Frankel [14] at three threshold magnitudes for the previously mentioned four depth zones; in the electronic supplement depicts one such model for representative threshold magnitude of MW 3.5 (Figure S1). In the electronic supplement shows the tectonic activity rates for a few representative areal/polygonal source zones for the threshold magnitude of MW 3.5 in the 0 km-25 km hypocentral depth range (Figure S2). This study uses a number of Ground Motion Prediction Equations (GMPEs) and regionally developed Spectral Next Generation Attenuation Models (NGAs) as listed in the electronic supplement (Table S1).
For assessing the precision of the NGA models developed for the eleven tectonic provinces, we have conducted a comparative analysis of the predicted PGA and PSA values considering, Atkinson and Boore [15], with simulated PGA and PSA values along with the residuals exhibiting a satisfactory agreement among all of them. Figures S3 and S4 in the electronic supplement present plots of PGA and residuals of PGA versus fault distance for two representative tectonic blocks of Kashmir Himalaya and northwest India. A log-likelihood LLH efficacy assessment has been performed to each Ground Motion Prediction Equation (GMPE) and Next Generation Attenuation (NGA) in order to determine their rank and to assign appropriate weights as presented in Tables S2-S7 of the electronic supplement for the six tectonic provinces of the Ensemble [16].
The greater the GMPE ranking index, the lower the LLH value will be. A pair-wise comparison matrix has been used to determine the normalized weights for each GMPE following only the case of Northwest India tectonic province has been presented in Table S8 in the electronic supplement for a representative depiction [17]. As outlined by Nath and Thingbaijam [8] the probability density functions for the residuals, source-to-site distance and magnitudes related to the GMPE have been included in the current investigation.
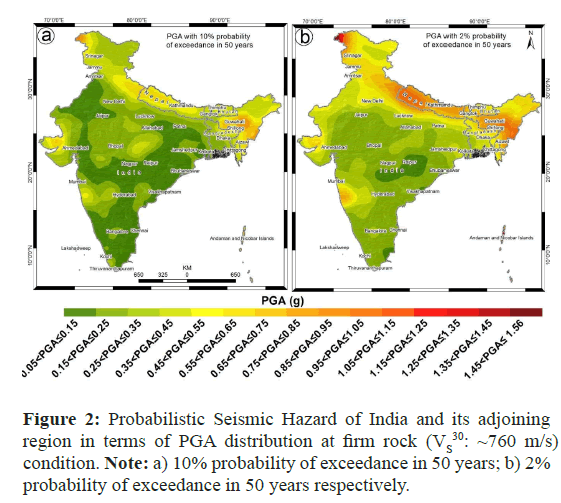
A Probabilistic Seismic Hazard (PSH) map of India at engineering bedrock (site class B, VS30=760 m/s) level (Figure 2(a)). In terms of PGA distribution for 10% probability of exceedance in 50 years, where it is seen to vary from 0.05 g to 0.95 g, while Figure 2(b) depicts spatial PSH distribution for 2% probability of exceedance in 50 years, as seen to vary from 0.074 g to 1.56 g. Further, the PSH distribution at bedrock level for 10% probability of exceedance in 50 years has been classified into five hazard zones viz. ‘low’ with 0.05 g<PGA ≤ 0.25g, ‘moderate’ with 0.25 g<PGA ≤ 0.45g, ‘high’ with 0.45 g<PGA ≤ 0.65 g, ‘very high’ with 0.65 g<PGA ≤ 0.8 g and ‘severe’ with 0.80 g<PGA ≤ 0.95 g. The tectonic provinces viz. Western Ghat mobile belt with important cities of Thiruvananthapuram and Kochi along with the Koyna-Warna seismic zone with Mumbai and Pune cities, the Eastern Ghat mobile belt zone with Chennai, Bangalore, Hyderabad, Vishakhapatnam, Vijayawada and Puducherry the Northwest India seismic zone with Jaipur and Amritsar, the Indo-Gangetic fore-deep with New Delhi, Allahabad, Lucknow and Patna, the Central India seismic zone with Bhopal, Nagpur and Raipur , the Bengal basin with Jamshedpur and Bhubaneswar cities, all exhibit ‘low’ hazard, with PGA varying from 0.05 to 0.25g. In contrast, the cities of Srinagar in the Kashmir Himalaya, Kathmandu in Nepal, Imphal and Aizawl in Northeast India are exhibiting ‘very high’ hazard level with PGA ranging from 0.65 g to 0.80 g.
The cities of Shillong and Guwahati in the seismically active northeast India along with the city Bhuj in Kutch tectonic province exhibit ‘severe’ hazard level with PGA ranging from 0.80 g to 0.95 g. Comparable level of hazard is observed in all the tectonic provinces depicting the maximum hazard scenario with a 2% probability of exceedance in 50 years with a return period of 2475 years (Figure 2b). Similarly, Pseudo Spectral Acceleration (PSA) has been calculated for 0.2 sec, 0.3 sec and 1.0 sec for both 10% and 2% probability of exceedance in 50 years under firm rock condition for India as depicted respectively in the electronic supplement (Figures S5-S7).
The bedrock PGA values from the present study with various published literatures have been compared for both 10% and 2% probability of exceedance in 50 years in Tables S9 and S10 in the electronic supplement respectively, showing a strong concurrence with most of the research reporting.
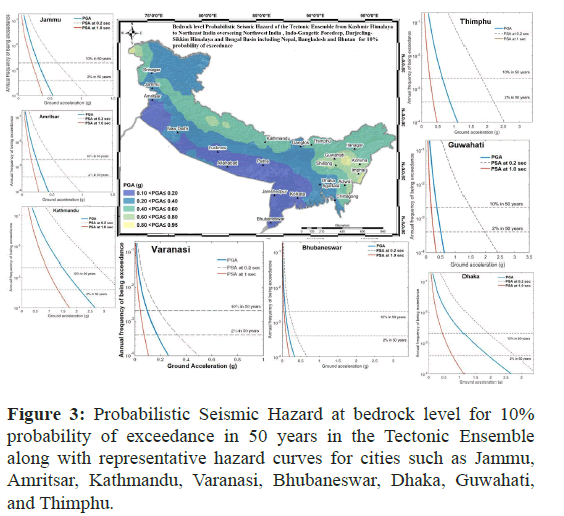
This probabilistic seismic hazard distribution of India places the tectonic ensemble extending from the tectonic provinces of Kashmir Himalaya to northeast India tectonic province including Bhutan along with northwest India including Nepal, Indo-Gangetic foredeep region, Bengal basin including Bangladesh, Darjeeling-Sikkim Himalaya in the “high” to “severe” hazard regime, thus presenting a model case study for a site-specific surface-consistent probabilistic seismic hazard (Figure 3). The computed seismic hazard curves in this diagram depict the probability of exceeding both 10% and 2% in 50 years for various ground motion parameters at a few representative selected cities.
Shear-wave velocity estimation as a proxy for site classification using surface and invasive techniques
Seismic site classification is based on effective shear-wave velocity (VS30) in the first 30 meters of the soil/sediment column. This information is critical for determining the stiffness of the soil/ sediment column towards seismic ground motion triggered by an earthquake in a given region.
This study adopts the site classification based on VS30, proposed by the uniform building code and the National Earthquake Hazard Reduction Program (NEHRP) that ranges from stiff soil (site class D: 180< VS30 ≤ 360 m/s) to hard rock (site class A: VS30>1500m/s) [18,19]. Further refined the classification by adding subcategories within each site class C and D [20]. However, soil/sediment having properties such as VS30<180m/s, average undrained shear strength <25 kPa, plasticity index >20 and moisture content ≥ 40 percentage are referred to as site class E in both these classification protocols.
Invasive (geophysical and geotechnical) and non-invasive (geophysical and geological) investigations: The entire tectonic ensemble has been thoroughly investigated using both invasive methods like standard penetration test and downhole seismic survey and non-invasive methods like microtremor survey and Spectral/ Multi-channel Analysis of Surface Waves (SASW/MASW), along with various laboratory tests to evaluate physical and shear properties of the soil/sediment.
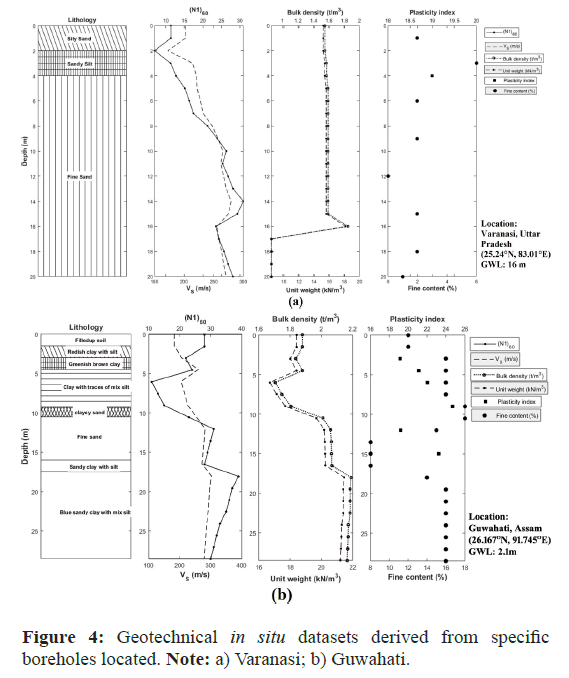
Geotechnical Investigation: Geotechnical field investigations, particularly the Standard Penetration Test (SPT) play a critical role in seismic site condition studies evaluating the subsurface soil/sediment properties to elucidate their response to seismic forces [21]. This is achieved by drilling 150 mm diameter boreholes with hydraulic feed rotary drilling. Based on, IS 2720 [22] extensive in situ field and laboratory testing have been performed on the collected soil/sediment samples to analyze bulk density.
Atterberg limits, grain size, fine content, natural moisture content and other pertinent parameters. Figure 4 show geotechnical datasets from a few representative sites in the tectonic ensemble, including the depth profiles of lithology, corrected N-values (N1)60 following, Youd et al. [23] shear-wave velocity (VS in m/s), bulk density (t/m3), unit weight (kN/m3), fine content and plasticity index.
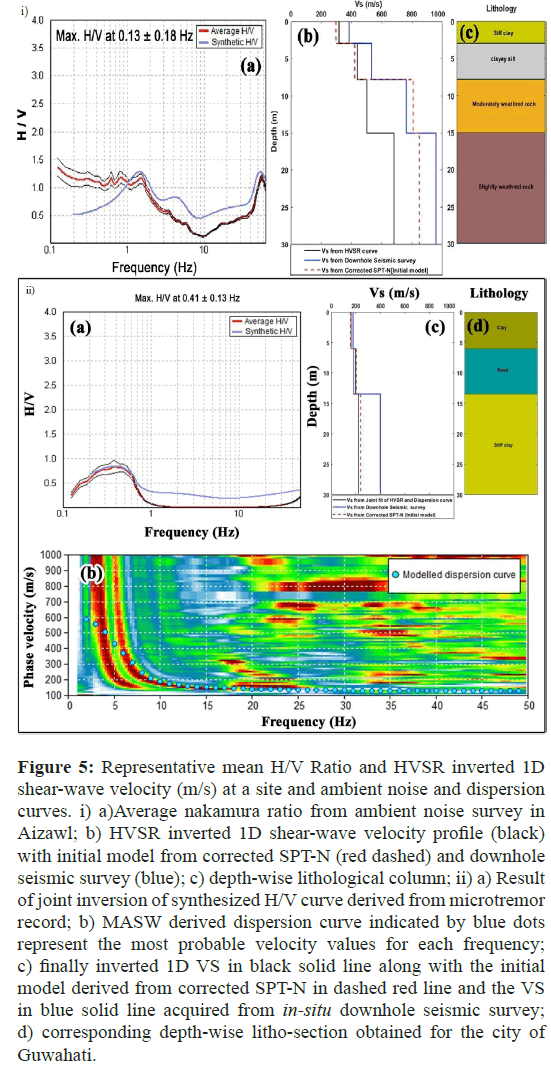
Geophysical Investigation: Different non-invasive and cost-effective geophysical techniques have been employed in the present study to ascertain subsurface shearwave velocity and interpret subsoil layer information through HVSR analysis of microtremor record, MASW and SASW techniques. In addition, these tests are popular because they effectively fill the identified data gaps. Ambient noise survey within 0 Hz-50 Hz frequency band has been conducted at each site at 128 Hz of sampling rate to retrieve shallow subsurface information through Horizontalto- Vertical Spectral Ratio (HVSR) analysis [24]. Representative mean H/V Ratio and HVSR inverted 1D shear-wave velocity (m/s) at a site in Aizawl city (Figure 5).
One of the distinctive features of surface waves is their dispersion properties in a multi-layered medium, facilitating these to be used to estimate the depth-dependent changes in shear-wave velocity (VS) through both Spectral Analysis of Surface Waves (SASW) and Multichannel Analysis of Surface Waves (MASW) methods. In SASW method, dynamic source generated Rayleigh-waves are recorded to observe phase difference between two receivers at known distances and subsequently converted into frequency domain using an appropriate mathematical transformation technique to form an investigational dispersion curve, which is then inverted to obtain the depth-wise VS profile [25].
In the MASW survey, surface waves data have been acquired in the field through a 24-channel geophone array with an active energy source. Subsequently, spectral inversion of the recorded data has been performed to generate surface wave phase velocity dispersion curves, followed by the generation of depth dependent shear-wave velocity profile. To address the shortcomings of SASW, the MASW technique has been improved by using multiple receivers in terms of effective field data acquisition, better noise reduction and more accurate shear-wave velocity profiling and enhanced dispersive characteristics. However, SASW/MASW provides data at higher frequencies for shallow layers, while microtremors capture lowfrequency information for deeper layers; both are combined through joint inversion technique to create a comprehensive, relatively wellconstrained subsurface soil/sediment model in terms of 1D shearwave velocity.
A representative 1D shear-wave velocity resulted from joint fit inversion of H/V curve from ambient noise and dispersion curves obtained from MASW survey at Guwahati is presented (Figure 5).
Figure 5: Representative mean H/V Ratio and HVSR inverted 1D shear-wave velocity (m/s) at a site and ambient noise and dispersion curves. i) a)Average nakamura ratio from ambient noise survey in Aizawl; b) HVSR inverted 1D shear-wave velocity profile (black) with initial model from corrected SPT-N (red dashed) and downhole seismic survey (blue); c) depth-wise lithological column; ii) a) Result of joint inversion of synthesized H/V curve derived from microtremor record; b) MASW derived dispersion curve indicated by blue dots represent the most probable velocity values for each frequency; c) finally inverted 1D VS in black solid line along with the initial model derived from corrected SPT-N in dashed red line and the VS in blue solid line acquired from in-situ downhole seismic survey; d) corresponding depth-wise litho-section obtained for the city of Guwahati.
Effective shear-wave velocity distribution through topographic gradient and a proxy derived from geology, geomorphology, landform and topographic gradient
Topographic gradient is a proxy for estimating VS30 in regional seismic site characterization studies. In the present study, an attempt has been made to develop the site classification map of the tectonic ensemble using topographic gradient-based approach considering Shuttle Radar Topographic Mission (SRTM) Digital Elevation Model (DEM) with a spatial resolution of 9 arcsec [26]. Based on the predicted VS30 values through topographic gradient, the site classification map for the tectonic ensemble has been categorized into four site classes viz. E, D, C and B as per NEHRP norms.
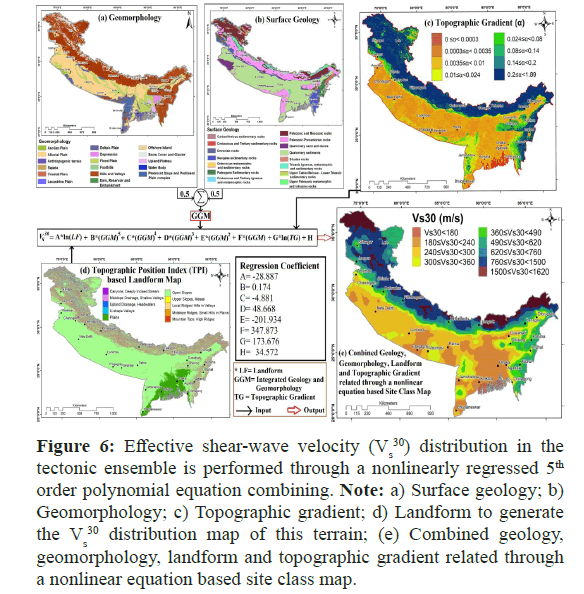
An attempt has been made in this study to incorporate geology, geomorphology, topographic gradient and landform in order to develop an alternative proxy for site classification, particularly in areas with low to medium slopes where topographic gradient has insignificant contribution. In the present study, a 5th order nonlinear polynomial regression relation of Nath et al. [15] has been worked out to estimate effective shear-wave velocity (VS30) of a location in the tectonic ensemble by incorporating all these attributes and features thus assessing the spatial distribution of VS30 for the tectonic ensemble in this study as illustrated (Figure 6).
Figure 6: Effective shear-wave velocity (Vs30) distribution in the tectonic ensemble is performed through a nonlinearly regressed 5th order polynomial equation combining. Note: a) Surface geology; b) Geomorphology; c) Topographic gradient; d) Landform to generate the Vs30 distribution map of this terrain; (e) Combined geology, geomorphology, landform and topographic gradient related through a nonlinear equation based site class map.
Surface geology and geomorphology, have been adopted from Geological Survey of India and other sources (Figures 6a and 6b) [27-29]. Shuttle Radar Topography Mission (SRTM) Digital Elevation Model (DEM) data of 9 arcsec spatial resolution have been used to calculate Topographic Gradient (Figure 6c). Landform data has also been computed using Topographic Position Index (TPI) method (Figure 6d) [30]. Combined geology, geomorphology, landform and topographic gradient related through nonlinear regression relationbased site classification map generated for the study region has been depicting a VS30 distribution varying from 110m/s to 1620m/s (Figure 6e).
The study region has been divided into two major topographic zones: High-altitude region delineated by “moderately steep slope” to “escarpment/cliff” with a slope value greater than 35° and low to mid-altitude regions defined by “very gentle slope” to “moderately steep slope” with a slope value less than 35° to correlate and establish the efficacy of both the regional site classification algorithms used in this study [31].
A correlation analysis has been performed between the Topographic Gradient (TG) based site classification and the site classification map generated by combining Geology, Geomorphology, Landform and Topographic Gradient (GGLTG) through nonlinear regression relation for high topographic gradient regions of the tectonic ensemble in the electronic supplement (Figures S8a and S8b). Figure S8c in the electronic supplement shows the correlation plot between the VS30 values derived from the two distinct approaches exhibiting a good clustering along the 1:1 correspondence line bounded by a standard deviation of ± 200 m/s, thus establishing the reliability of this higher order polynomial-based proxy relation in predicting S-wave velocity in the high altitude region of the tectonic ensemble.
On the other hand, in order to validate the accuracy of the nonlinear regression relation based site classification map combining geology, geomorphology, landform and topographic gradient in the low to mid-altitude regions of the tectonic ensemble, 20,000 VS30 data acquired through both invasive and non-invasive techniques have been used. The TG-based VS30, GGLTG-based VS30 and measured VS30 driven site classification maps have been presented respectively in the electronic supplement (Figures S9a-S9c).
These three types of VS30 values have been correlated in the electronic supplement, which exhibits a strong clustering between measured VS 30 and GGLTG-based VS30 along the 1:1 correspondence line with a standard deviation of ± 110 m/s demarcated by dark orange points, in contrast the TG-based VS30 values show a large scattering with respect to the 1:1 correspondence line thus indicating an over-prediction of shear-wave velocity in comparison with the measured VS30 designated by blue points in the same plot in the electronic supplement (Figure S9d). Therefore, geology, geomorphology, landform and topographic gradient based VS30 driven site classification module combined through nonlinear regression relation can be considered a reliable alternative proxy for localspecific VS30 estimation in areas of low to mid-altitude regions of the tectonic ensemble where exhaustive geophysical and geotechnical investigation could not have been possible.
Numerous depth-wise, site-specific and lithology-dependent empirical relationships developed by Nath et al. [13] have been used in this study to estimate shear-wave velocity from Standard Penetration Test (SPT-N) values; these correlations have been developed particularly for the alluvial-filled topography of the Brahmaputra valley, the Indo-Gangetic foredeep region, the Bengal basin and Northwest India. Although there are observed data points in higher Himalayan region, extensive data acquisition was not possible due to inaccessibility in the high altitudes.
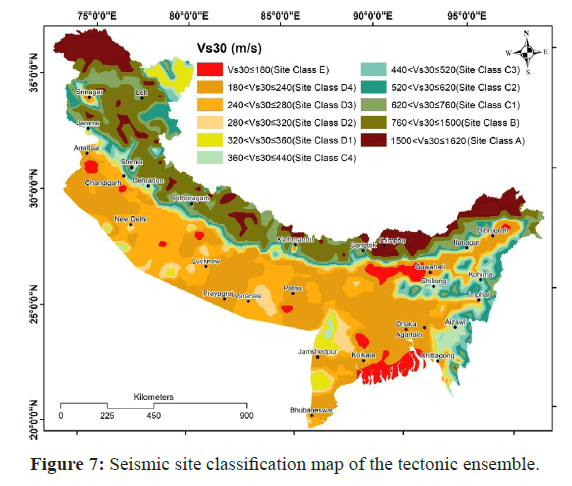
Thus, this comprehensive study integrates site-specific shearwave velocity measurements from various surface geophysical and geotechnical borehole data in low altitude regions, with topographic gradient based shear-wave velocity in high-altitude areas, combined geology, geomorphology, landform and topographic gradient based nonlinear regression related shear-wave velocity in mid-altitude plateaus etc., to generate spatial distribution of effective shear-wave velocity database across the entire Tectonic ensemble region which in turn aided in categorizing the terrain into eleven site classes, namely E, D4, D3, D2, D1, C4, C3, C2, C1, B and A, following the collective guidelines of UBC [18], NEHRP [19], and Sun et al. [20] as depicted (Figure 7). In order to ascertain the reliability of the calculated/measured VS30 in the current assessment, a comparison between the presented VS30 with those reported by other researchers for several cities and urban centres within the Tectonic ensemble have been performed which depicts an excellent match as evident from Table S11 given in the electronic supplementary material.
1D/2D/3D site response analysis and surface-consistent PSHA of the tectonic ensemble
Understanding the strong ground motion resulting from an earthquake is important from both engineering seismology and earthquake engineering perspectives. It is essential to comprehend the intricacies of the fault system, the rupture process and the nearfield seismic wave propagation.
Strong ground motion synthesis: The stochastic strong ground motion synthesis works on the idea that high-frequency ground motion generated by an earthquake is described by a band-restricted white Gaussian noise of finite duration, limited by corner frequency (fo) and the peak frequency (fmax) using seismic moment Mo at a distance R from the fault rupture as postulated by [32]. This methodology is subsequently expanded to finite-fault stochastic modeling [33]. In this model, the rupture plane of the finite fault is split into smaller sub-faults, each treated as a point source and the contributions from each sub-fault are summed. Source parameters considered for strong ground motion synthesis employing the Earthquake Simulation (EXSIM) package have been gathered from the Global Centroid Moment Tensor (GCMT) catalogue and other published literatures [34].
Site response analysis: Seismic site response refers to the changes in earthquake ground motion as it propagates through different subsurface geological strata, where soil/sediment properties can amplify or de-amplify the ground motion, altering ground shaking intensity and frequency content at the ground surface relative to engineering bedrock (VS 30 ~ 760 m/s). Seismic site response analysis, therefore, is critical in assessing the ground motion amplification and soil-structure interaction effects during an earthquake. In the present study, 1D/2D/3D dynamic site response has been performed using DEEPSOIL, PLAXIS 2D and PLAXIS 3D software packages simultaneously to capture the realistic behavior of soil/sediment, providing an accurate representation of ground motion modification at the site.
The 1D site response technique, based on Idriss and Seed [35] and implemented in DEEPSOIL, evaluates soil/sediment behavior under seismic loading using various geotechnical parameters like soil/sediment type, layer thickness, shear-wave velocity and unit weight, along with synthesized ground motion at the engineering bedrock [36].
The analysis assumes a homogeneous, semi-infinite half-space with vertical seismic wave propagation. Amplification of ground motion in soft sediments are primarily caused by seismic wave entrapment owing to impedance contrast. The dynamic soil/sediment behavior is modelled by adjusting elastic properties based on induced strain levels and the site amplification factor is thereby determined yielding surface ground motion. Wave propagation from source to site provides the basis for the use of 1D site response analysis. However, a limitation of the 1D approach is that it assumes infinitely extended, homogeneous horizontal soil/sediment layers, neglecting significant horizontal variations in soil/sediment properties and making these assumptions insufficient in the regions with slopping, irregular ground surfaces or rugged topography [37]. Therefore, a 2D site response analysis is performed to account for the variation of ground motion amplification both vertically and horizontally.
The mechanical behaviour of soil/sediments can be defined by appropriate models that use iterative methods to estimate the inelastic response using an average shear modulus over a loading cycle to approximate hysteresis loop and direct numerical integration to capture dynamic response. The analysis incorporates various constitutive soil/sediment models for accurate calculations, through cyclic modulus degradation and pore-pressure generation. To address the limitations of 1D modeling, dynamic ground response analysis has been performed in this study using time-domain integration with PLAXIS 2D for 2D layered model and PLAXIS 3D for 3D inhomogeneous stratified model. PLAXIS 2D, a widely-used 2D finite element software, is employed to model intricate soil/sediment layering, lateral spreading and soil-structure interaction effects [38].
A detailed 2D model of the geometric cross-section is constructed, specifying soil layers, material properties, structural elements, boundary conditions and dynamic load types, thereafter, a 2D mesh is generated. Present study employed the Linear Elastic (LE) model and Soft-Soil Creep (SSC) model in PLAXIS to show the behavior of soils/sediments under dynamic loading. The linear elastic model is an effective model-type applied to simulate the behavior of various soil/sediment types. Soil/sediment exhibit viscoelastic effect such as time-dependent creep and primary compression, followed by certain amounts of secondary compression.
This phenomenon is predominant in soft soils, including typically consolidated clay, silt and peat. The linear elastic model, along with other models like hardening soil, fails to consider the viscoelastic phenomena, hence the soft-soil creep model which is considered most appropriate in case of soft soils. In both the models, the dynamic analysis settings, such as time step parameters and convergence criteria, are set and the analysis is executed followed by a post-processing using PLAXIS' visualization tools, allowing for the analysis of displacements, velocities, accelerations and excess pore pressures. However, PLAXIS 2D, restricted by 2D constraints and simplified geometry, cannot fully capture complex 3D geotechnical behavior under dynamic conditions, therefore, this study utilizes PLAXIS 3D for a comprehensive analysis of three-dimensional soil/ sediment interactions under dynamic loading.
For finite element formulations in PLAXIS 3D, a threedimensional soil/sediment volume model has been created and the model is discretized into a 3D mesh consisting of finite number of tetrahedral elements. Five meshing options are available from very coarse to very fine. Material properties like damping parameters, soil/ sediment stiffness parameters, shear strength parameters and unit weight acquired from geotechnical investigations are assigned to all the soil/sediment layers. Linear Elastic (LE) Model and Soft-Soil Creep (SSC) models have been employed for dynamic site response analysis. Dynamic boundary conditions are set as None/Viscous in the X, Y and Z directions with viscous boundaries on lateral sides and input ground motion applied at the model base. The synthesized bedrock-level acceleration time history has been used as input to generate surface acceleration.
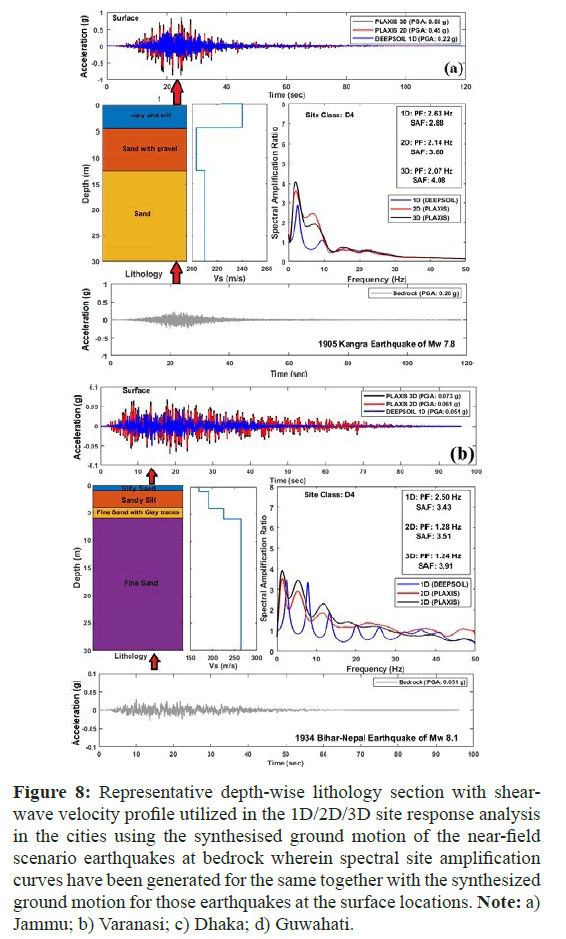
Representative depth-wise lithology section with shear-wave velocity profile utilized in the 1D/2D/3D site response analysis in the cities using the synthesised acceleration time histories of the scenario earthquakes at bedrock wherein spectral site amplification curves have been generated and are presented for the same together with the synthesized accelerograms shown for those earthquakes at the surface locations in the same diagram at Jammu, Varanasi, Dhaka and Guwahati respectively (Figure 8). It is observed from figures 8a and 8b that at Jammu 1D DEEPSOIL analysis provided a Predominant Frequency (PF) of 2.63Hz with an Spectral Amplification Factor (SAF) of 2.88 and the surface PGA of 0.22g while the same by PLAXIS 2D is found to be PF: 2.14Hz, SAF: 3.60, surface PGA: 0.45 g and that by PLAXIS 3D it is: PF=2.07Hz, SAF=4.08 and surface PGA=0.55 g; similarly at Varanasi it is seen that DEEPSOIL provided a Predominant Frequency (PF) of 2.50Hz, with an Spectral Amplification Factor (SAF) of 3.43 and the surface PGA of 0.051g while the same by PLAXIS 2D is found to be PF:1.28 Hz, SAF:3.51, surface PGA:0.061 g and that by PLAXIS 3D is PF:1.24 Hz, SAF:3.91 and surface PGA:0.073 g. The same exercise has been performed at Dhaka and Guwahati and several other cities in the ensemble using synthesised scenario earthquakes yielding a similar pattern. A comparison of the results shows that predominant frequency, amplification factor and surface-consistent PGA values are significantly higher in both PLAXIS 2D and 3D analyses than in 1D DEEPSOIL, but do not show appreciably higher difference between the 2D and 3D results (Figure 8).
Figure 8: Representative depth-wise lithology section with shearwave velocity profile utilized in the 1D/2D/3D site response analysis in the cities using the synthesised ground motion of the near-field scenario earthquakes at bedrock wherein spectral site amplification curves have been generated for the same together with the synthesized ground motion for those earthquakes at the surface locations. Note: a) Jammu; b) Varanasi.
Thus, making the utility of PLAXIS 2D as most viable and appropriate approach for routine analysis due to its being costeffective, less computation intensive but performs appreciably accurate site response analysis in contrast to both 1D and 3D estimation. This is particularly feasible in a huge seismotectonic ensemble like the one in the present study comprising of six large and active tectonic provinces with more than 20,000 locations from where a large volume of geotechnical and geophysical data has been acquired for site response analysis for surface-consistent probabilistic seismic hazard assessment for both 475 and 2475 years of return periods.
In this study EXSIM software has been employed to synthesize strong ground motion at engineering bedrock for near-field earthquakes wherein the source parameters have been adopted directly from Global Centroid-Moment-Tensor (CMT) solutions and/or from published results from available literatures, monographs, reports etc. The amplification factors have been generated for a minimum of five near-field earthquakes for providing a maximum occurring value at each node point, which is further utilised to calculate surfaceconsistent probabilistic seismic hazard.
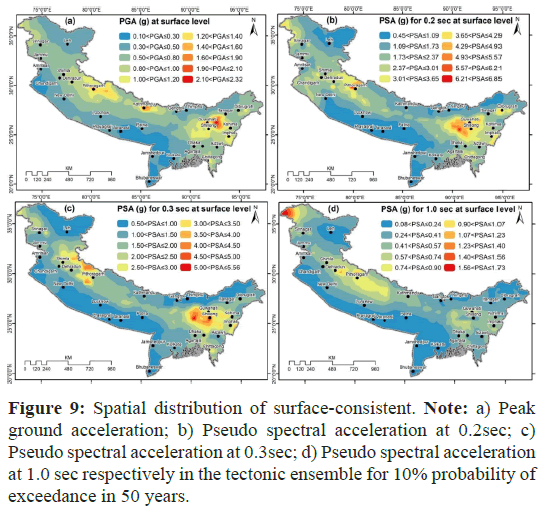
The Surface-consistent probabilistic seismic hazard thus calculated from the bedrock level hazard in terms of PGA and PSA at 1.0 sec, 0.3 sec and 0.2 sec periods in this tectonic ensemble have been found to vary in the tune of 0.10 g -2.32 g, 0.08 g -1.73 g, 0.50 g-5.56 g and 0.45 g-6.85 g, respectively for a return period of 475 years (Figure 9). The Tectonic Province of Kashmir Himalaya exhibits a surface PGA of 0.29 g-1.18 g wherein the cities of Jammu and Srinagar show maximum PGA values of 0.63 g and 0.8 g respectively.
Figure 9: Spatial distribution of surface-consistent. Note: a) Peak ground acceleration; b) Pseudo spectral acceleration at 0.2sec; c) Pseudo spectral acceleration at 0.3sec; d) Pseudo spectral acceleration at 1.0 sec respectively in the tectonic ensemble for 10% probability of exceedance in 50 years.
The northwest India tectonic province is found to have surface PGA of 0.44-1.78 g, in which the cities of Chandigarh, Shimla and Dehradun exhibit maximum PGA of 0.66 g, 0.91 g and 0.90 g respectively.
The country of Nepal depicts a surface PGA of 0.44 g -1.70 g with the capital city Kathmandu presenting maximum PGA of 1.62g. Indo-Gangetic fore-deep region exhibit surface PGA of 0.23 g -1.09 g; the important cities of Varanasi and Lucknow depict maximum PGA values of 0.28 g and 0.36 g respectively. Bengal basin tectonic province including Bangladesh is seen to be associated with a surface PGA of 0.10 g -1.30 g with Bhubaneswar and Dhaka exhibiting maximum PGA of 0.13 g and 0.55 g respectively for 475 years of return period. In case of Northeast India, the surface PGA has been found to vary in the range of 0.37 g-2.32 g, in which capital cities of Guwahati, Aizawl, Imphal, Agartala, Shillong, Itanagar and Kohima exhibit maximum surface PGA of 1.92g, 0.72 g, 1.5 g, 0.63 g, 1.506 g, 0.611 g and 0.93 g respectively for a 475 years of return period. The country of Bhutan exhibits a surface PGA of 0.45 g -0.505 g, where the capital city Thimphu is seen to have a maximum surface PGA of 0.505 g. The surface PGA of the tectonic province Darjeeling- Sikkim Himalaya is found to be in the range of 0.43 g -0.47 g with the state capital Gangtok exhibiting a maximum PGA of 0.45 g for 10% probability of exceedance in 50 years. The obtained surfaceconsistent PGA in the present work as well as those reported by others for few important cities in the tectonic ensemble also shows a good agreement as presented in Table S12 of the electronic supplement, thus highlighting the effectiveness of the procedural methodology used here.
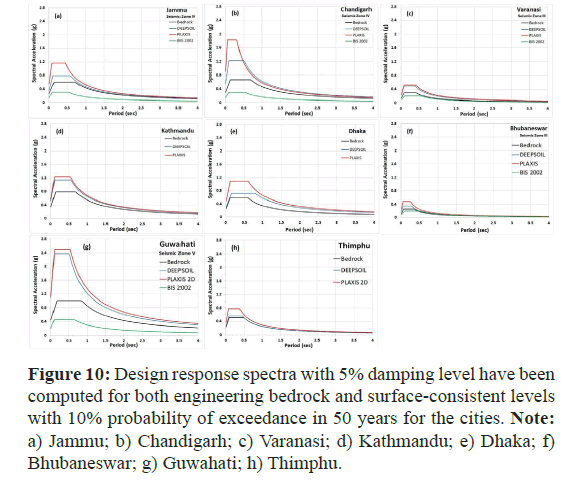
Figure 10 displays significant enhancement in the design response spectral values for the 5% damped design response spectra produced in accordance with the international building code [39] employing the PSA at 1.0 sec and 0.2 sec with 10% probability of exceedance in 50 years at both bedrock level and DEEPSOIL and PLAXIS 2D derived surface level values as also with respect to that of BIS [40] for eight representative cities taken from the present study region namely, Jammu, Chandigarh, Varanasi, Kathmandu, Dhaka, Bhubaneswar, Guwahati and Thimphu.
Figure 10: Design response spectra with 5% damping level have been computed for both engineering bedrock and surface-consistent levels with 10% probability of exceedance in 50 years for the cities. Note: a) Jammu; b) Chandigarh; c) Varanasi; d) Kathmandu; e) Dhaka; f) Bhubaneswar; g) Guwahati; h) Thimphu.
Secondary hazard assessment in terms of liquefaction and landslide susceptibility
Liquefaction and related ground failure are significant contributors to infrastructure damage in unconsolidated, non-cohesive and watersaturated alluvial terrains during large earthquakes. The Brahmaputra valley in northeast India, the Bengal basin lying on the alluvial deposits of the Ganga-Brahmaputra-Meghna delta, Indo-Gangetic foredeep region and Kashmir valley of Kashmir Himalaya are characterized by subsurface litho-stratigraphic layers with varying amounts of clay, cohesion less silt, sand and gravel. Occurrences of many disastrous earthquakes namely the 1885 Bengal earthquake of MW 6.8, the 1897 Shillong earthquake of MW 8.1, the 1918 Srimangal earthquake of MW 7.6, the 1930 Dhubri earthquake of MW 7.1, 1934 Nepal-Bihar earthquake of MW 8.1, 2015 Gorkha-Nepal earthquake of MW 7.8, 2005 Muzaffarabad earthquake of MW 7.6 etc. implicating Modified Mercalli (MM) intensity of VIII-X in near-source region reportedly triggered sporadic liquefaction in the region. Therefore, these regions are particularly susceptible to liquefaction, as documented in the regions such as Jammu, Kashmir valley, Lucknow, Delhi, Kathmandu, Bengal basin including Bangladesh, Guwahati, Agartala and Imphal [41-50]. A comprehensive analysis of soil liquefaction has been conducted for the present tectonic ensemble, utilizing geotechnical data to simulate liquefaction potential. The evaluation involves Cyclic Stress Ratio (CSR) and Cyclic Resistance Ratio (CRR), determined using soil/sediment parameters such as soil/sediment type, SPT-N value, unit weight, fine content, plasticity index and groundwater level, using the formulations of [51,52]. To assess resistance against liquefaction, the Factor of Safety (FOS) is estimated as the ratio of CRR to CSR [23]. The Liquefaction Potential Index (LPI) has been derived from FOS [53,54]. The computational protocol for liquefaction assessment has been adopted from [55].
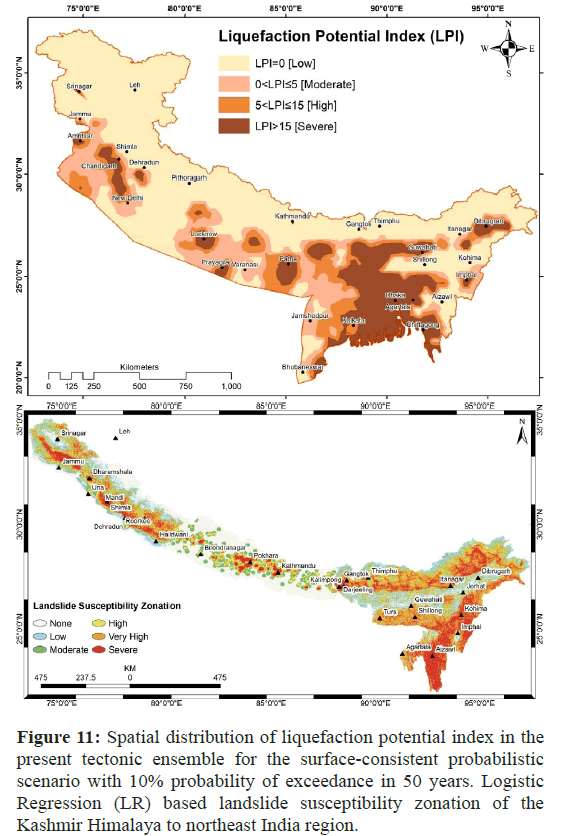
Surface-consistent Peak Ground Acceleration (PGA) values estimated for 10% probability of exceedance in 50 years have been employed to simulate liquefaction potential of the study region. The spatial distribution of LPI for the probabilistic scenario has been presented (Figure 11). The predicted probabilistic LPI distribution for a 475 year return period categorizes the region into four zones: “Low (LPI=0)” in Leh, Shimla, Dehradun, Thimphu, Gangtok, Shillong, Aizawl, Kohima and Bhubaneswar; “moderate (0<LPI ≤ 5)” in Jammu, New Delhi and Varanasi; “high (5<LPI ≤ 15)” in Chandigarh, Prayagraj and Kolkata and “severe (LPI>15)” in Srinagar, Amritsar, Lucknow, Patna, Kathmandu, Dhaka, Chittagong, Guwahati, Imphal and Agartala.
Figure 11: a) Spatial distribution of liquefaction potential index in the present tectonic ensemble for the surface-consistent probabilistic scenario with 10% probability of exceedance in 50 years. b) Logistic Regression (LR) based landslide susceptibility zonation of the Kashmir Himalaya to northeast India region.
The Indian subcontinent is one of the top four regions globally at high landslide risk, particularly in mountainous terrains like the Kashmir Himalaya, Northwest India, Darjeeling-Sikkim Himalaya and Northeast India including Bhutan. Covering 0.40 million km², these zones are highly susceptible to landslides due to steep slopes, complex geological structures and seismic activity, often isolating communities by disrupting key road networks. Historic and recent events, such as the 2011 Tindharia and 2017 Kotrupi landslides, emphasize the need for hazard management, leading to the preparation of Landslide Susceptibility Mapping (LSM) in this study.
Initially, a landslide inventory has been prepared, out of which 70% has been randomly picked as training dataset and the remaining 30% as the testing dataset. Thereafter, binary Logistic Regression (LR) based Landslide Susceptibility Index (LSI) has been prepared through thirteen causative factors viz. surface geology, lineament density, landform, elevation, slope angle, slope aspect, drainage density, Normalized Differences Vegetation Index (NDVI), Land Use/ Land Cover (LULC), distance to road, rainfall, epicenter proximity and Surface-consistent Peak Ground Acceleration (PGA) with 10% probability of exceedance in 50 years on GIS platform [56-58]. The regression coefficient for each thematic layer has been assigned based on training landslide inventory database. The LR model calculated coefficients for each explanatory variable, which indicate the strength and direction of their influence on landslide susceptibility. Distance to Lineament and Normalized Difference Vegetation Index (NDVI) plays a positive relationship indicating that the variable increases the likelihood of landslide occurrences. Conversely, slope curvature with negative coefficients indicates a negative relationship, wherein the variable decreases the likelihood of landslide occurrences. Thereupon, the LSI has been classified into six susceptibility zones, viz. “none”, “low”, “moderate”, “high”, “very high” and “severe” as shown (Figure 11). The LSI Map is used as the designated secondary hazard thematic layer for the integral microzonation of high-altitude urban centres alongside liquefaction for those in the alluvial-filled flat topography urban destinations. In the urban and semi-urban centres viz. Darjeeling, Gangtok, Kalimpong, lower part of Bhutan, Mongar, Koloriang, Itanagar, Aizawl, Kohima, Parts of Meghalaya and Tripura, Kathmandu, Pokhara, Birendranagar, Baramulla, Munsyari, Chamoli, Mandi, Palampur, Uttarkahi, Shimla and Chamba, Srinagar, Kupwara, schools, colleges, health centres and other life-supporting infrastructure, including essential transportation systems have been badly affected due to frequent occurrence of landslides in the region.
Representative integral seismic hazard microzonation of the cities of Jammu, Chandigarh, Varanasi, Kathmandu, Dhaka, Bhubaneswar, Guwahati and Thimphu
Considering the recurrent seismic activity in most of the cities and urban centres located in the present tectonic ensemble, sitespecific seismic hazard and microzonation studies are imperative, particularly, the cities situated in seismic zones III, IV and V of BIS Seismic Zonation map of India and have population exceeding one million. Seismic microzonation segments a region into sub regions with tailored safeguards against catastrophic earthquakes using both experimental and theoretical approaches. It considers geomorphological, geological, topographical and geotechnical factors, along with seismological attributes like Peak Ground Acceleration (PGA), site response, liquefaction potential and landslide susceptibility. Multi-criteria decision-making tools assign weights to these attributes based on regional criteria. Given the need to strengthen seismic resilience, continuous efforts in urban planning, infrastructure development and disaster preparedness are crucial to safeguard inhabitants and foster sustainable growth. Here, eight cities within the tectonic ensemble Kathmandu, Jammu, Chandigarh, Varanasi, Bhubaneshwar, Dhaka, Guwahati and Thimphu-each with unique seismic histories and challenges, have been selected in the present study.
In order to conduct multi-criteria seismic hazard microzonation, an integration technique based on Saaty [17] Analytic Hierarchy Process (AHP) has been used as previously been employed in Dhanbad, Kachchh, Kolkata, Chennai, Guwahati and Sikkim Himalaya [47,59-63].
This study employs the AHP hierarchical structure based on user judgment to assign the relative importance of thematic layers through a pairwise comparison matrix, yielding normalized weights for each theme. The Consistency Ratio (CR), defined as ratio of the Consistency Index (CI) to the Random Index (RI), should be ideally below 0.1 [17].
Variability within themes prompts reclassification into different types or ranges, named as features, each ranked within their respective themes and thereby normalized ensuring no layer exceeds its assigned influence [60]. The hazard themes relevant to the study region, manifested as thematic layers on a GIS platform, include:
• Surface-consistent Peak Ground Acceleration (PGA) for a 475 years of return period having the utmost contribution to the hazard.
• Secondary hazard in terms of Probabilistic Liquefaction Potential Index (LPI) pertinent to flat land areas, or Landslide Susceptibility Index (LSI) for hilly regions.
• Site Class (SC) attributing to soil conditions.
• Predominant Frequency (PF) being an important factor for urban planning aspect.
• Geomorphology (GM) reflecting physiography related to ground subsidence or liquefaction.
• Surface geology (GL) depicting the ground condition. Each layer is geo-referenced using a UTM projection system.
• Weights and ranks are assigned to the layers based on their influences on seismic hazard. PGA receives the highest priority, followed by LPI/LSI, SC, PF, GM and GL. The integration of all the seismic-hazard and geo-hazard thematic layers has been carried out using the hierarchy-based AHP method on GIS platform to calculate Seismic Hazard Index (SHI) as per [47,60].
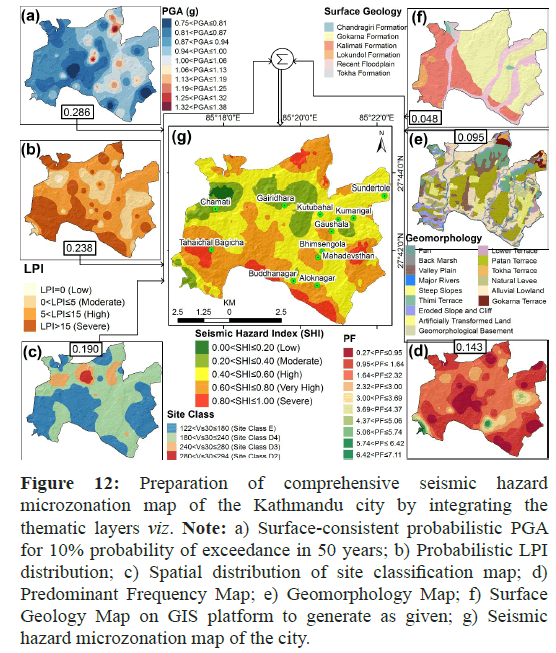
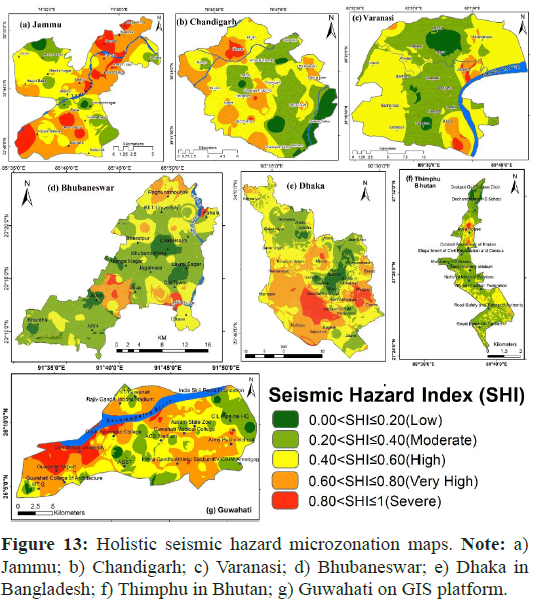
The computed Seismic Hazard Index (SHI) has been characterized into five classes viz. “low (0.00<SHI ≤ 0.20)”, “moderate (0.20<SHI ≤ 0.40)”, “high (0.40<SHI ≤ 0.60)”, “very high (0.60<SHI ≤ 0.80)” and “severe (0.80<SHI ≤ 1.00)”. In the present study, we have prepared the seismic hazard microzonation maps of a few important major cities like Kathmandu, Jammu, Chandigarh, Varanasi, Bhubaneshwar, Dhaka, Guwahati and Thimphu in the tectonic ensemble by integrating the aforementioned hazard themes on GIS platform for the case of Kathmandu city (Figure 12). The Tahachal Bagicha, along with southeastern part of Kathmandu city fall under ‘Severe’ hazard zone, while, Aloknagar, Mahadevsthan, Gaucharan region are lying in ‘very high’ hazard zone (Figure 12 g).
Figure 12: Preparation of comprehensive seismic hazard microzonation map of the Kathmandu city by integrating the thematic layers viz. Note: a) Surface-consistent probabilistic PGA for 10% probability of exceedance in 50 years; b) Probabilistic LPI distribution; c) Spatial distribution of site classification map; d) Predominant Frequency Map; e) Geomorphology Map; f) Surface Geology Map on GIS platform to generate as given; g) Seismic hazard microzonation map of the city.
Thus by adopting the same methodology for the remaining cities viz. Jammu, Chandigarh, Varanasi, Bhubaneswar, Dhaka, Guwahati and Thimphu, the seismic hazard microzonation maps have been prepared and presented (Figure 13). It is observed from the seismic hazard microzonation map of the city of Jammu, that the northeastern and southwestern parts of the City encompassing Narrain, Babliana, Raipur Satwari, Reka and Jeevan Nagar lie in the 'very high' to 'severe' hazard zones while the central part of the city including Transport Nagar, Baljata and Roop Nagar locations lie in the ‘moderate’ to ‘low’ hazard zones. The Chandigarh city is classified mostly in the 'high' to 'severe' hazard zones that encompasses most of the western parts of the city. Locations like Dhanas, ISBT 43, Sector 50, Rock Garden and Sukhna Lake have been observed with ‘very high’ to ‘severe’ hazard, while the eastern region of the city that includes Sarangpur, Punjab University and DRDO, lie in the ‘low’ to ‘moderate’ hazard zones. In case of the Varanasi city, the northern and southern regions, encompassing Jaitpura, Hiramanpur, Lanka, BHU, Kurauti and Sadalpur landmark, is seen to lie in the ‘high’ to ‘severe’ hazard zones. The central part of the city lies in the ‘low’ to ‘moderate’ hazard zones. In case of the city of Bhubaneswar, ‘severe’ hazard zone is observed along the active flood plains of Daya and Kaukhai rivers, while ‘high’ to ‘very high’ hazard patches are seen in the northeast and west-central parts of the city. In case of the city of Dhaka, Kotowali and Khilgaon are seen to lie in the ‘severe’ hazard zone, Beraid, Kalakandi, Demra, Hemayetpur and Basundhara lies in the ‘very high’ hazard zone while Gokulnagar, Hazratpur, Shimuliya, Mohakhali, Uttara, Savar, Bongaon and Dhanmandi lie in the ‘high’ hazard zone. Northern part of the city of Thimphu encompassing India House and Cabinet Secretariat of Bhutan, along with some scattered parts in south lie in the ‘high’ to ‘severe’ hazard zones. While the landmarks of Drakpoi Golf Course Club and Dechencholing HS School in North, along with most of the central part of the city encompasses ‘low’ to ‘moderate’ hazard zones. Significant parts of the Guwahati city, including IIIT-G, Guwahati Airport, Don Bosco School, Rajiv Gandhi Indoor Stadium, Guwahati Medical College, etc. have been categorized under ‘high’ to ‘severe’ hazard zones, while the eastern and central territories of the city lie under ‘low’ to ‘moderate’ hazard regime.
Structural impact assessment in terms of damage potential modelling in some selected representative cities in the tectonic ensemble from Kashmir Himalaya to Northeast India
Unplanned urban expansion and inadequate building codes are continually elevating earthquake vulnerability in urban centres which are situated in high seismic hazard zones of the tectonic ensemble from Kashmir Himalaya to Northeast India, with Peak Ground Acceleration (PGA) values reaching up to 2.32 g. This highlights the necessity of a thorough assessment of seismic damage potential in terms of structural factors. In the event of a destructive earthquake, effective pre-disaster preparedness and post-disaster response, including relief, rescue and rehabilitation, can be facilitated by various tools such as Hazard-US (HAZUS), Risk Assessment Tools for Diagnosis of Urban Areas against Seismic Disasters (RADIUS), Earthquake Loss Estimation Routine (ELER), Early Post-Earthquake Damage Assessment Tool (EPEDAT) and Seismic Loss Estimation using a Logic Tree Approach (SELENA), whether used individually or in combination. In this study, we model the expected building damage using SELENA as the computational platform to assess the implications of seismic hazard models. The ability of a building to withstand seismic forces is closely associated with its structural type. To predict the likelihood of damage, detailed information such as the building footprint, number of model building types, built-up area, earthquake sources, empirical ground motion prediction relationships, soil map, capacity and fragility functions and cost schedules for different model building types are most essential; all of which are the key components of the globally practiced SELENA package. This study deployed the damage potential computation algorithm described in Molina et al. [64] whose flow diagram has been depicted in [13].
Capacity spectrum method based structural damage assessment: The capacity spectrum is the fundamental principle behind SELENA [65]. It compares response spectra from the input ground motion with the building-specific capacity curve. Based on the given ground motion relationship, which includes the selection of the capacity spectrum, the generation of the demand spectrum and the computation of performance points, the damage probability has been estimated in each of the 5000 sample geo-units chosen in each city and urban center in every tectonic province of the tectonic ensemble. Three control points on the building capacity curve such as design, yield and ultimate capacity, define its behavior, progressing from elastic linearity to a plastic state at yield and ultimately fully plastic at the ultimate point.
The demand spectrum curve produced using spectral displacements at 0.3 sec and 1.0 sec is used to calculate the peak building response. The performance point is recognized as the point where the building capacity and the seismic demand curves meet. The calculation of damage probabilities requires fragility or vulnerability curves for four damage states computed as lognormal probability distribution of damage from the specified capacity curve as described in [64].
The displacement obtained from the performance point is overlaid onto fragility curves to assess damage probability in various states: "None," "slight," "moderate," "extensive," and "complete." This study adopts fragility and capacity characteristics from, NIBS [66]while model building types conform to nomenclature [67-68]. There are a total of 12 model building types identified in the Tectonic ensemble as detailed in [13].
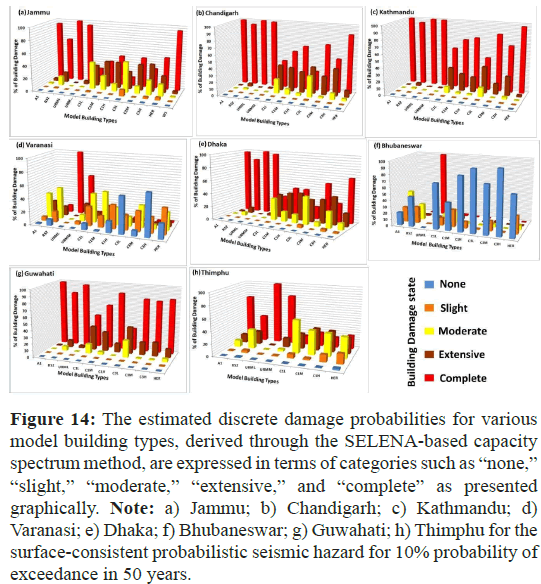
In the city of Jammu in the Kashmir Himalaya, 68%-100% of W1, A1, RS2, Un-Reinforced Masonry Low-rise (URML) and Un-Reinforced Masonry Mid-rise (URMM) building types may suffer “complete” damage, while the remaining building types in the city may endure “moderate” to “extensive” damage. In Chandigarh located in Northwest India, the majority of the A1, RS2, URML, URMM, C3M and Heritage (HER) type buildings may experience “complete” damage, while other building types may suffer “extensive” to “complete” damage. One of the major urban centres in the Indo-Gangetic Foredeep tectonic region known as the spiritual capital of India, Varanasi, has model building types, of which 63%-99% of URML and URMM building types may face “complete” damage, while 17%-49% of reinforced concrete buildings may attain “slight” to “moderate” damage state. In Bhubaneswar, located in the western part of the Bengal Basin, a majority of both the ductile and non-ductile reinforced concrete buildings have been observed to be in a secure state, in contrast, in the city of Dhaka, situated in the eastern part of the Bengal basin, it is estimated that 19%-100% of buildings across all typologies may experience “complete” damage state. However, when it comes to earthquake induced structural damage, northeastern India poses a dire threat because all the building types existent in the city of Guwahati are susceptible to “complete” damage and destruction. While RS2, C1L, C1M, C1H and HER types of buildings in Thimphu are likely to face “slight” to “moderate” damage states, the majority of A1, URML and URMM types of buildings are susceptible to “complete” damage states. With the exception of C1L and C3L building types, predicted to be safe, the majority of building types in Kathmandu, the capital city of Nepal, are highly vulnerable to ground shaking damage. Considering surface-consistent probabilistic seismic hazard for 10% probability of exceedance in 50 years, the probabilities of each damage state for the model building types identified in the cities of Jammu, Chandigarh, Varanasi, Bhubaneswar, Dhaka, Thimphu, Guwahati and Kathmandu are graphically represented as bar plots (Figures 14a-14h).
Figure 14: The estimated discrete damage probabilities for various model building types, derived through the SELENA-based capacity spectrum method, are expressed in terms of categories such as “none,” “slight,” “moderate,” “extensive,” and “complete” as presented graphically. Note: a) Jammu; b) Chandigarh; c) Kathmandu; d) Varanasi; e) Dhaka; f) Bhubaneswar; g) Guwahati; h) Thimphu for the surface-consistent probabilistic seismic hazard for 10% probability of exceedance in 50 years.
Generation of damage probability in the five tectonic provinces West-Northwest Himalaya, North-Central Himalaya, Nepal, Northeast India and Bhutan
The seismic vulnerability of the Himalayan region, spanning over Nepal, Bhutan and the three tectonic blocks of Northeast India, North-Central Himalaya and West-Northwest Himalaya, has been a subject of extensive engineering seismological research and analysis. this study, built upon the work of Gautam et al. [64] analyses into the damageability functions for different building typologies, namely Adobe (A1), Unreinforced Masonry (URM) and Reinforced Concrete (RC) structures. Damageability functions are generated by plotting damage probability against intensity, PGA, Peak Ground Velocity (PGV), or Peak Ground Displacement (PGD) or any other ground shaking factors, which are defined as the probability of sustaining any damage. Based on an exhaustive literature review, the current study region has been divided into five tectonic regimes depending upon the nature of the earthquakes and damage patterns. The Himalayan belt, characterized by continuous Indian plate convergence beneath the Eurasian plate, triggered frequent major earthquakes, inflicting substantial damage in the country of Nepal, such as1833 Nepal earthquake of MW 7.6, 1934 Bihar-Nepal earthquake of MW 8.1, 2015 Gorkha-Nepal earthquake of MW 7.8, 1980 Chainpur earthquake of MW 6.5 and the 2023 Nepal earthquake of MW 5.7 as documented by National Emergency Operation Centre (NEOC) and [70-73]. The North- Central Himalayan region, notably Uttar Pradesh and Bihar of India, faced severe impacts as reported by the events of 1988 Nepal-Bihar earthquake of MW 6.9, 2011 Sikkim earthquake of MW 6.9, 2015 Gorkha-Nepal earthquake of MW 7 and 1833 Nepal earthquake of MW 7.6 [74-76].
The Department of Disaster Management of Government of Bhutan documented district-wise building damages in Bhutan from historical earthquakes, viz. 2003 Paro earthquake of MW 5.5, 2006 Dewangthang earthquake of MW 5.8 and the 2009 Bhutan earthquake of MW 6.1; moreover, highlighted the seismic vulnerability of Bhutanese residential buildings due to recent earthquakes [77,78]. On the other hand, reported extensive damage to structures in several regions of Northeast India due to 2017 Ambasa earthquake MW 5.7, 2016 Manipur earthquake of MW 6.7, 2011 Sikkim earthquake of MW 6.9 and 2021 Sonitpur earthquake of MW 6.4 [79-81]. The West-Northwest Himalaya has a long history of seismic activity, experiencing numerous earthquakes over the centuries. The Himachal Pradesh State Disaster Management Authority and other sources documented extensive earthquake-related damage across the Kashmir-Himachal Pradesh to Delhi-Haryana region and surrounding areas, notably from major events like the 1803 Garhwal earthquake of MW 7.5, 1828 Srinagar earthquake of MW 6.5, 1905 Kangra earthquake of MW 7.8, 1975 Kinnaur earthquake of MW 6.8, 1991 Uttarkashi earthquake of MW 6.8, 1995 Chamba earthquake of MW 4.9, 1997 Sundernagar earthquake of MW 4.7, 1999 Chamoli earthquake of MW 6.5, 2004 Dharamshala earthquake of MW 4.9, 2005 Muzaffarabad earthquake of MW 7.6, 2012 Jhajjar earthquake of MW 5.1, 2013 Bhaderwah-Kishtwar earthquake of MW 5.1 and the 2019 Kashmir earthquake of MW 5.6, which caused significant destruction to unreinforced masonry, adobe and concrete structures [82-93].
Using reported data on the number of buildings damaged during significant earthquakes, in conjunction with the total number of buildings determined through remote sensing techniques based on imagery data from the corresponding period. Damage Probability has been estimated and plotted against the Modified Mercalli Intensity (MMI). For various tectonic regions, including North-Central Himalaya, Nepal, Northeast India, Bhutan and West-Northwest India for “Adobe (A1)”, “Unreinforced Masonry (URM)” and “Reinforced Concrete (RC)” model buildings. The curves for the most prevalent building type RC have been presented here (Figure S11). The SELENA package has been employed to assess damage states for 12 model building types across these scenario earthquakes and Surface-consistent Probabilistic Seismic Hazard. The resulting damage state domains for RC buildings have been overlaid on the diagrams for each territory, illustrating “slight,” “moderate,” “extensive,” and “complete” damage states. These diagrams demonstrate a compelling alignment between the reported building damages and SELENA-generated damage states, establishing a good agreement between the SELENA-modelled building damage states for RC-type buildings and damage probability distribution variation against Modified Mercalli Intensity (MMI) and/ or equivalent converted PGA(g) using the formulations across all the three tectonic territories, along with Nepal and Bhutan, for various scenario earthquakes and Surface-consistent Probabilistic Seismic Hazard distribution for 10% probability of exceedance in 50 years [94].
Although the present study is yet another attempt at modeling seismic hazard, microzonation and damage potential, its uniqueness lies in the integration of six dissimilar tectonic blocks, spanning from the Kashmir Himalaya to Northeast India, into a unified tectonic assemblage, with the accomplishment of all engineering aspects. Probabilistic Seismic Hazard for the Indian subcontinent has been conducted considering both 10% and 2% probability of exceedance in 50 years at engineering bedrock within a logic tree framework encompassing 172 areal polygonal and 3216 significant tectonic seismogenic sources, multiple threshold moment magnitudes of 3.5, 4.5 and 5.5, depth-dependent variation of seismic activity rates and maximum earthquake prognosis for depth ranges 0 km-25 km, 25 km-70 km, 70 km-180 km and 180 km-300 km, a comprehensive set of 197 Ground Motion Prediction Equations (GMPEs) including 68 Next Generation Spectral Attenuation models (NGAs) developed by Nath [2], and Nath et al. [13] along with aleatory and epistemic uncertainties pertaining to rupture distance, magnitude and GMPEs/ NGA of all depth-wise seismogenic sources throughout the Tectonic ensemble.
Enriched comprehensive database comprising of extensive volume of geophysical, geotechnical, geological, geomorphological and topography data which has been employed to estimate the effective shear-wave velocity (VS 30) along with a regional-specific empirical relationship using nonlinear regression with a 5th order polynomial equation, thus classified the region into different site classes according to protocol [18-20].
The lithology guided and depth-wise empirical relationships between VS and SPT-N have also been applied to the alluvial region recognizing sixteen lithological units as outlined by [13]. 1D/2D/3D site response analysis has been executed using DEEPSOIL and PLAXIS 2D/3D software across the region, estimating parameters such as absolute and spectral site amplification factors and predominant frequency, thus yielding the surface-consistent Probabilistic Seismic Hazard along with design response spectra at both surface and bedrock levels for few capital cities and urban centres. Finally, microzonation and urban structural impact assessments utilizing SELENA have been conducted in selected cities viz. Jammu, Chandigarh, Kathmandu, Varanasi, Bhubaneswar, Dhaka, Guwahati and Thimphu focusing on the surface level Probabilistic Seismic Hazard. For the three seismically active regions of the West-Northwest Himalaya, the North-Central Himalaya and Northeast India along with Bangladesh, Bhutan and Nepal, seismic damageability functions have been developed for the prevalent Reinforced Concrete (RC)-type buildings. Therefore, this work has established a distinctive benchmark for a combined regional and local seismic hazard and disaster model.
Conclusion
The susceptibility of contemporary society to earthquake hazard is continuously rising. An extensive evaluation of Surface-consistent Seismic Hazard, Microzonation and Structural Impact Studies might help reduce the threat from social and economic damage caused by earthquakes. Characterizing site conditions has played key role in quantifying seismic hazard, particularly in high-risk urban regions. Seismic hazard assessment aided in understanding and mitigating the risks associated with earthquakes, offering critical insights into the potential for ground shaking. The microzonation maps presented here serve as a tool for identifying potential severe to high hazard zones critical for site selection and design of public facilities and infrastructure systems. By synergizing these approaches, one can develop a holistic understanding of seismic risk, facilitating informed decision-making in urban planning, infrastructure development and disaster preparedness. Utilizing this approach, specific strategies will be developed to enhance structural resilience, enact effective building codes and implement reduction measures to safeguard lives and infrastructure.
References
- BMTPC (2019) Vulnerability Atlas of India. Building Materials and Technology Promotion council, Ministry of Housing & Urban Affairs, Government of India, third edition.
- Nath SK (2017) Probabilistic Seismic Hazard Atlas of 40 Cities in India. Ministry of Earth Sciences, Government of India, New Delhi, pp 457.
- Nath SK, Thingbaijam KKS, Raj A (2008) Earthquake hazard in Northeast India-a seismic microzonation approach with typical case studies from Sikkim Himalaya and Guwahati city. J Earth Sys Sci 117(2):809-831.
- Cornell CA (1968) Engineering seismic risk analysis. Bull Seismol Soci Am 58:1583-1606.
- Esteva L (1970) Seismic Risk and Seismic Design Decisions. Cambridge. pp 142-82.
- Kijko A (2004) Estimation of the maximum earthquake magnitude. Pure App Geophy161:1655-1681.
- Kijko A, Graham G (1998) Parametric-historic procedure for probabilistic seismic hazard analysis: Part I - estimation of maximum regional magnitude max. Pure Appl Geophy 152:413-442.
- Nath SK, Thingbaijam KKS (2012) Probabilistic seismic hazard assessment of India. Seismological Res Lett 83 (1):135–149.
- Nath SK, Adhikari MD, Maiti SK, Devaraj N, Srivastava N, et al. (2014) Earthquake scenario in West Bengal with emphasis on seismic hazard microzonation of the city of Kolkata, India. Nat Haz Earth Sys Sci 14:2549–2575.
- Maiti SK, Nath SK, Adhikari MD, Srivastava N, Sengupta P, et al. (2017) Probabilistic seismic hazard model 762 of West Bengal, India. J Earthquake Engin 21(7):1113-1157.
- Nath SK, Mandal S, Adhikari MD, Maiti SK (2017) A Unified Earthquake Catalogue for South Asia coveringthe period 1900-2014. Natural Hazards 85(3):1787-1810.
- McGuire RK (1976) FORTRAN Computer Program for Seismic Risk Analysis. Open-File Report U S. Geological Survey.
- Nath SK, Ghatak C, Sengupta A, Biswas A, Madan J, et al. (2021) Regional–local hybrid seismic hazard and disaster modeling of the five tectonic province ensemble consisting of Westcentral Himalaya To Northeast India. Springer 14: 307-358.
- Frankel A (1995) Mapping seismic hazard in the central and eastern United States. Seis Res Lett 66(4):8-21.
- Atkinson GM, Boore DM (2006) Earthquake ground-motion prediction equations for eastern North America. Bul Seismol Sociof Am 96(6):2181-2205.
- Scherbaum F, Delavaud E, Riggelsen C (2009) Model selection in seismic hazard analysis: An information-theoretic perspective. Bul Seismol Soci Am 99(6):3234-3247.
- Saaty TL (1980) The Analytic Hierarchy Process. McGraw-Hill International, New York, U.S.A.
- UBC (1997) Uniform Building Code: International Conference of Building Officials.
- BSSC (2003) NEHRP Recommended Provisions for Seismic Regulations for New Buildings and Other Structures. FEMA Washington D.C.
[Google Scholar][Crossref]
- Sun CG, Kim HS, Cho HI (2018) Geo-proxy-based site classification for regional zonation of seismic site effects in south korea. App Sci 8(2):314.
- Kulhawy FH, Mayne PW (1990) Manual on estimating Soil Properties for Foundation Design. Geotechnical Engineering Group.
- IS 2720-1 (1983) Methods of test for soils, Part 1: Preparation of dry soil samples for various tests. Bureau of Indian Standards, New Delhi.
- Youd TL, Idriss IM, Andrus RD, Arango I, Castro G, et al. (2001) Liquefaction resistance of soils: Summary report from the 1996 NCEER and 1998 NCEER/NSF workshops on evaluation of liquefaction resistance of soils.J Geotech Geoenv Engin 127(10):817-833
- Nakamura Y (2000) Clear identification of fundamental idea of Nakamura’s technique and its applications.12th world conference on earthquake engineering, New Zealand, Auckland, Vol. 2656.
- Park CB, Miller RD, Xia J (1998) Imaging dispersion curves of surface waves on multi-channel record. In: SEG Expanded Abstracts 17(1):1377-1380.
- Allen TI, Wald DJ (2009) On the Use of High-Resolution Topographic Data as a Proxy for Seismic Site Conditions (VS 30). Bull Seismol Sociof America 99(2A):935–943.
- USGS, GSB (2001) Digital geologic and geophysical data of Bangladesh. U.S. Geological Survey Open-File Report 97-470-H.
- Long S, McQuarrie N, Tobgay T, Grujic D (2011) Geometry and crustal shortening of the Himalayan fold- thrust belt, eastern and central Bhutan. Geological Society of America Bulletin 123:1427–1447.
- Dhital MR (2015) Geology of the Nepal Himalaya: Regional perspective of the classic collided orogeny. Springer.
- 30. Weiss A (2001) Topographic position and landforms analysis. In: Poster presentation, ESRI user conference, San Diego, CA, Vol. 200.
- Balasubramanian A. (2017) India-Topography and Slope. University of Mysore.
- Boore DM (1983) Stochastic simulation of high-frequency ground motions based on seismological models of the radiated spectra. Bull Seismol Soci of Am 79:1865-1894.
- Motazedian D, Atkinson GM (2005) Stochastic finite-fault modeling based on a dynamic corner frequency. Bull Seismol Soci of America 95:995-1010.
- Atkinson GM, Assatourians K (2015) Implementation and validation of EXSIM (a stochastic finite-fault ground-motion simulation algorithm) on the SCEC broadband platform. Seismol Res Letter 86:1.
- Idriss IM, Seed HB (1968) Seismic response of horizontal soil layers. J Soil Mech Found Division 94 (SM4):1003-1031.
- Hashash YMA, Musgrove MI, Harmon JA, Ilhan O, Xing G, et al. (2020) DEEPSOIL 7, User Manual. Board of Trustees of University of Illinois at Urbana- Champaign.
- Kramer S (1996) Geotechnical Earthquake Engineering. NJ, USA.
- PLAXIS (2023) PLAXIS 2D Reference Manual. Bentley Systems International Limited, Dublin.
- IBC (2009) International Building Code. International Code Council, Inc., Country Club Hills, Illinois.
- BIS (2002) Indian Standard Criteria for Earthquake Resistant Design of Structures. Buildings Bureau of Indian Standards. New Delhi.
- Ansari A, Zahoor F, Rao KS, Jain AK (2022) Liquefaction hazard assessment in a seismically active region of Himalayas using geotechnical and geophysical investigations: A case study of the Jammu Region. Bull Engi Geol Envi 81:349.
- Sana H, Nath SK (2016) Liquefaction potential analysis of the Kashmir valley alluvium, NW Himalaya. Soil Dyn Earthquake Eng 85:11-18.
- Kumar A, Anbazhagan P, Sitharam TG (2013) Liquefaction hazard mapping of Lucknow: A part of Indo- Gangetic Basin (IGB). Int J Geotech Earthq Engin 4(1):17-41.
- Rao KS, Satyam DN (2007) Liquefaction studies for seismic microzonation of Delhi region. Current science, 92(5):646-654.
- Subedi M, Acharya IP (2022) Liquefaction hazard assessment and ground failure probability analysis in the Kathmandu Valley of Nepal. Geoenviron Disasters 9(1):1-17.
- Pokhrel RM, Gilder CE, Vardanega PJ, De Luca F, De Risi R, et al. (2022) Liquefaction potential for t Kathmandu Valley, Nepal: A sensitivity study. Bulletin Earthq Engin 20(1):25-51.
- Nath SK, Biswas A, Srivastava A, Sengupta A, Ghatak C, et al. (2022) Site-specific seismic hazard and risk potential of Bengal Basin with emphasis on holistic seismic hazard microzonation and its structural impact assessment in the cities of Dhanbad and Mymensingh. Frontiers Earth Sci 10:959108.
- Raghukanth STG, Dash SK (2010) Evaluation of seismic soil-liquefaction at Guwahati city. Envi Earth Sci 61:355–368.
- Das S, Ghosh S, Kayal JR (2019) Liquefaction potential of Agartala City in Northeast India using a GIS platform. Bull Eng Geol Environ 78:2919-2931.
- Pallav K, Raghukanth STG, Singh KD (2012) Liquefaction Hazard Scenario of Imphal City for 1869 Cachar and a Hypothetical Earthquake. Int J Geotech Earthq Eng 3(1):34-56.
- Seed HB, Idriss IM (1971) Simplified procedure for evaluating soil liquefaction potential. J Soil Mec 97(9):1249-1273.
- Seed HB, Tokimatsu K, Harder LF, Chung RM (1985) Influence of SPT procedures in soil liquefaction resistance evaluations. J Geotech Geoenvi Engin 111(12):1425-1445.
- Iwasaki T, Tatsuoka F, Tokida KI, Yasuda S (1978) A practical method for assessing soil liquefaction potential based on case studies at various sites in Japan. Construc Res Appl 2: 885-896.
- Iwasaki T, Tokida KI, Tatsuoka F, Watanabe S, Yasuda S, et al. (1982) Microzonation for Soil Liquefaction Potential Using Simplified Methods. 3rd international conference on microzonation 3:1310-1330.
- Nath SK, Srivastava N, Ghatak C, Adhikari MD, Ghosh A, et al. (2018) Earthquake induced liquefaction hazard, probability and risk assessment in the city of Kolkata, India: Its historical perspective and deterministic scenario. J. Seismol 22 (1): 35–68.
- Sengupta A, Nath SK (2024) Landslide Susceptibility and Risk Mapping in the Tectonic Ensemble Comprising of Eastern Himalayan Zone, Northeast India and Bhutan using Logistic Regression and Random Forest Techniques. J Geolog Soci India 100(2):168–180.
- Sengupta A, Nath SK, Mishra J (2020) GIS-Based Machine Learning Technique for Landslide Susceptibility Mapping in The Northwest Himalaya. International-India Geoscience and Remote Sensing Symposium 254–257.
- Nath SK, Sengupta A, Srivastava A (2021b) Remote sensing GIS-based landslide susceptibility & risk modeling in Darjeeling–Sikkim Himalaya together with FEM-based slope stability analysis of the terrain. Natural Hazards 108:3271–3304.
- Pancholi V, Bhatt N, Singh P, Chopra S (2022) Multi-criteria approach using GIS for macro-level seismic hazard assessment of Kachchh Rift Basin, Gujarat, western India–First step towards earthquake disaster mitigation. Journal of Earth System Science, 131(1):1-20.
- Nath SK, Adhikari MD, Maiti SK, Devaraj N, Srivastava N, et al. (2014) Earthquake scenario in West Bengal with emphasis on seismic hazard microzonation of the city of Kolkata, India. Nat Hazards Earth Syst Sci 14: 2549-2575.
- Ganapathy GP (2011) First level seismic microzonation map of Chennai city - a GIS approach. Nat Hazards Earth Syst Sci 11: 549-559.
- Nath SK, Thingbaijam KKS, Raj A, Shukla K, Pal I, et al. (2007) Seismic Microzonation of Guwahati City. International workshop on Earthquake Hazard and Mitigation, Guwahati, India.
- Nath SK (2004) Seismic hazard mapping and microzonation in the Sikkim Himalaya through GIS integration of site effects and strong ground motion attributes. Nat Hazards 31(2): 319-342.
- Molina S, Lang DH, Lindholm CD (2014) SELENA v6.0: User and Technical Manual v6.0.
- Molina S, Lang DH, Lindholm CD (2010) SELENA-an open-source tool for seismic risk and loss assessment using logic tree computation procedure. Comput Geosci 36(3): 257-269.
- NIBS (2002) HAZUS99 - Earthquake Loss Estimation Methodology, Technical Manual. National Institute of Building Sciences (NIBS) 325.
- FEMA (2000) Prestandard and commentary for the seismic rehabilitation of buildings. Federal Emergency Management Agency 356.
- WHE-PAGER (2008) Whe-Pager Project: A New Initiative in Estimating Global Building Inventory and its Seismic Vulnerability. Proceedings of the 14th World Conference on Earthquake Engineering, Beijing, China 12-17.
- Gautam D, Rupakhety R, Adhikari R, Shrestha BC, Baruwal R, et al. (2021) Seismic vulnerability of Himalayan stone masonry: Regional perspectives. Masonry Construction in Active Seismic Regions 25-60.
- Pandey MR, Molnar P (1988) The distribution of intensity of the Bihar-Nepal earthquake of 15 January 193 and bounds on the extent of the rupture zone. J Nepal Geol Society 5(1): 22-44.
- Bilham R (1995) Location and magnitude of the 1833 Nepal earthquake and its relation to the rupture zones of contiguous great Himalayan earthquakes. Curr Sci 69(2): 101-128.
- Chaulagain H, Gautam D, Rodrigues H (2018) Revisiting major historical earthquakes in Nepal: Overview of 1833, 1934, 1980, 1988, 2011, and 2015 seismic events. Impacts and insights of the Gorkha earthquake 1-17.
- Singh V (1982) Earthquake of July 1980 in far western Nepal. J Nepal Geol Society 2(2): 1-11.
- Gupta SP (1988) Report on Eastern Nepal Earthquake of 21 August 1988.
- Fujiwara T, Sato T, Murakami HO, Kubo T (1989) Reconnaissance report on the 21 August 1988 earthquake in the Nepal-India border region. Res Repo Natural Disasters, Japanese Group for the Study of Natural Disaster Science.
- Dasgupta S, Mukhopadhyay B (2015) Historiography and commentary from archives on the Kathmandu (Nepal)–India earthquake of 26 August 1833. Indian J History Sci 50:491-513.
- Chettri N, Gautam D, Rupakhety R (2021) Seismic vulnerability of vernacular residential buildings in Bhutan. J Earthq Eng 1: 1.
- Gautam D, Chettri N, Tempa K, Rodrigues H, Rupakhety R (2022) Seismic vulnerability of Bhutanese vernacular stone masonry buildings: From damage observation to fragility analysis. Soil Dyn Earthq Eng 160: 107351.
- Halder L, Dutta SC, Sharma RP (2020) Damage study and seismic vulnerability assessment of existing masonry buildings in Northeast India. J Build Eng 29: 101190.
- Dey C, Santanu B, Mohamed FA, Saikia S, Molia N, et al. (2022) The 28 April 2021 kopili fault earthquake (MW 6.1) in Assam valley of North East India: Seismotectonic appraisal. Pure Appl Geophys 1: 16.
- Debbarma J, Debnath J (2021) Assessment on the impact of the Tripura earthquake (January 3, 2017, MW=5.6) in Northeast India. J Geogr Inst Jovan Cvijic 71(1): 1-13.
- Mukhopadhyay B, Dasgupta S (2015) Seismic hazard assessment of Kashmir and Kangra valley region, western Himalaya, India. Geomat Nat Hazards Risk 6(2): 149-183.
- Bhargava ON, Ameta SS, Gaur RK, Kumar S, Agrawal AN, et al. (1978) The kinnaur (HP India) earthquake of 19 January 1975: Summary of geoseismological observations. Bulletin Indian Geol Assoc 11(1): 39-53.
- Singh S, Jain AK, Sinha P, Singh VN, Srivastava LS (1976) The Kinnaur earthquake of January 19, 1975: A field report. Bull Seismol Soc Am 66(3): 887-901.
- Arya AS (1994) Uttarkashi (India) Earthquake. Earthquake Engineering, 10th World Conference 7039-7043.
- GSI (1992) Uttarkashi Earthquake of October 20, 1991. Geological Survey of India.
- Pandey RJ (2013) Natural disasters and risk assessment in Uttarakhand with special reference to Uttarkashi earthquake. IOSR 9(3):37-42.
- Mahajan AK (1998) The 24th March, 1995 chamba earthquake (NW Himalaya), field observations and seismotectonics. J Geol Society of India 51(2): 227-232.
- Thakur VC, Mahajan AK, Mundepi AK, SriRam V, Pandey HC, et al. (1997) The Sundernagar Earthquake 962 (NW Himalaya) Of 29ᵗʰ July, 1997 Field Observations and Seismotectonics. Wadia Institute of Himalayan Geology, Dehradun.
- Paul DK (2000) A Report on Chamoli Earthquake of March 29, 1999.
- Mahajan AK, Kumar N, Arora BR (2006) Quick look isoseismal map of 8 October 2005 Kashmir earthquake. Curr Sci 91(3): 356-361.
- Kumar RP, Murty CVR (2014) Earthquake safety of houses in India: Understanding the bottlenecks in implementation. Indian Concrete J Centre Earthq Eng Int.
- Gupta AK, Chopra S, Prajapati SK, Sutar AK, Bansal BK (2013) Intensity distribution of M 4.9 Haryana Delhi border earthquake. Nat Hazards 68(2): 405-417.
- Anbazhagan P, Bajaj K, Moustafa SS, Al‐Arifi NS (2016) Relationship between intensity and recorded ground‐motion and spectral parameters for the Himalayan region. Bull Seismol Soc Am 106(4):1672-1689.
 Spanish
  Chinese
  Russian
  German
  French
  Japanese
  Portuguese
  Hindi
Hindi 