Spanish
  Chinese
  Russian
  German
  French
  Japanese
  Portuguese
  Hindi
Hindi Research Article, J Biodivers Manage Forestry Vol: 13 Issue: 2
Possible solutions to be applied in Saudi ports to preserve the marine ecosystem
Kataki Fisher*, A Elentably, Schutt Holger, A Alghanmi and S Alhrbi
Department of Maritime Studies, King Abdulaziz University, Jeddah, Saudi Arabia
*Corresponding Author: Kataki Fisher
Department of Maritime Studies,
King
Abdulaziz University,
Jeddah,
Saudi Arabia,
Tel: 966564678686;
E-mail: specialissueseries@gmail.com
Received date: 30 June, 2022, Manuscript No. JBMF-22-68129; Editor assigned date: 04 July, 2022, PreQC No. JBMF-22-68129 (PQ); Reviewed date: 18 July, 2022, QC No. JBMF-22-68129; Revised date: 29 August, 2022, Manuscript No. JBMF-22-68129 (R); Published date: 05 September, 2022, DOI: 10.4172/2327-4417.1000023.
Citation: Fisher K, Elentably A, Holger S, Alghanmi A, Alhrbi S (2022) Possible Solutions to be Applied in Saudi Ports to Preserve the Marine Ecosystem. J Biodivers Manage Forestry 11:6.
Abstract
By developing possible solutions for Saudi ports to limit the increase in damage to the marine ecosystem, the random system for estimating the waiting time of ships in Saudi ports has been developed as a model to guide the application of the multiple benefits to the beneficiaries such as ship owners, shipping companies and port authorities so that it is applied to create multiple economic and environmental savings. An imperative optimization model for solving container slot allocation problems for time sensitive commodities under the dynamics of port congestion pricing. The proposed new pricing mechanism has proven to be effective when compared to a generic slot allocation model that does not take into account shipping time limits and port congestion, with results showing that the proposed pricing scheme can significantly improve ship companies revenues and improve customer satiation. In terms of reducing carbon emissions from the ship's stay for a longer period at the docks.
Keywords: Ecosystem, Stochastic model, Congestion, VTT, Turnaround
Introduction
Given that, the Vessel Turnaround Time (VTT) is one of the key performance measures used by international shipping lines to determine which transshipment hub ports to use; this research looks into the factors that influence container vessel turnaround times. It was observed that a number of factors influence vessel turnaround time as a result, crucial parameters under the control of the terminal operator were analyzed for a more in-depth analysis using the stochastic model. VTT refers to the amount of time a ship spends in port from arrival to departure [1].
Despite the fact that it is offered as a separate time measure, VTT is a summation of several sub activities such as waiting for a berth, maneuvering time, mooring/unmooring time, idle time, container handling time, and other time components until the vessel exits port limits. Independent variables (Xi) are used to describe the influential components, while VTT is a dependent variable (Y). Because ships are built to sail, the more time they spend on the water, the more money they make. As a result, ship owners and shipping lines expect faster port operations, which will lead to shorter VTTs and more load trips per year.
In the year 2000, an average sized container vessel spent around 60% of its time at berths, with a daily cost of $65000, according to Ghotb, Kia, and Shayan [2].
Container terminals are specified operational entities specializing in the handling and storage of containerized cargo activities, according to Ting, where containers can be unloaded, loaded, received, delivered, stored and assisted movement across different modes of transportation (vessels, barges, trucks and railways etc.) [3]. To establish the key predictors of container port technical efficiency in Niavis and Tsekeris, the researchers used data from a Tobit Regression and a Truncated Regression (TR), as well as Parametric Bootstrapping Models (PBM).
The study, which is based on previous research, finds that port performance improves as port size grows, meaning that larger ports outperform smaller ports. According to Alemán, et al. Efficiency Analysis (EA) research, port efficiency in growing regions is increasing, with time series data indicating a 10% increase from 51% in 2000 to 61% in 2010. According to the study, improvements in liner connectivity, private sector participation, government sector corruption reduction, and the development of multi modal links have all influenced port efficiency levels in rising regions. Cariou and Oliveira, used a TR and a PBM to investigate how competition affects container port efficiency at various levels of impact [4].
In Sanchez, Tovar and Wilmsmeier, the researchers used non parametric data envelopment analysis to study the effects of dynamic economic circumstances on container terminal efficiency and productivity. Between 2005 and 2011, the study looked at 20 container terminals in ten countries across Latin America, the Caribbean, and Spain. Waiting time, container handling time and overall ship turnaround time are the primary metrics used to evaluate container terminal performance [5].
The availability and assignment of a suitable berth for an arriving vessel can have a significant impact on the measure above. He employed a mixed integer programming model for berth allocation and QGC assignment, which provides optimal solutions for time and energy savings in overall berthing expenses [6].
Stochastic approach using distributions in container vessel
Recommend Erlang random variables for two crane kinds, however Choi and Yun proposes normal random variables (quay, yard). In terms of crane cycle time, Koh, et al. recommend using a Weibull random variable; Bugaric and Petrovic propose normal random variables for a bulk cargo terminal and report the estimated parameters. Traditional numerical discretization approaches, on the other hand, are often used to ordinary or partial differential equations stated as underlying physical or mathematical problems [7].
Materials and Methods
In Saudi Arabia there are total three ports namely: Dammam, Jeddah and Jubail. Among these three ports there is no large TEUs with a capacity of more than 4 million. The two ports namely, Dammam and Jeddah comes under medium (0.5-4 million TEUs) and Jubail port is small (less than 0.5 million TEUs). East Asian ports dominate the top 50 ranking ports. Yokohama port (Japan) is the top ranked container port in the CPPI 2020, followed by King Abdullah port (Jeddah, Saudi Arabia) in second place. Regardless of the approach, these two ports occupy the same two locations [8].
In order to explore within the limited scope of this work, the following assumptions are established for assessing terminal data for our study (Figure 1).

Figure 1: Flow chart of VVT to assess the expected waiting time.
• Waiting time (c), time gap between anchor in and anchor out.
• Loaded and empty containers (μ) can be handled at the same speed.
• Containers on decks and hatches (β) can be handled at the s ame speed.
• Crane operators maintain the same handling speed from start to finish (d).
Model to estimate the expected waiting time
The existence or absence of a random variable is referred to as "stochastic." Stochastic processes have several essential hypotheses about time and state variables. Stochastic models will help us identify and predict the hidden components. The shifted exponential distribution can be used to simulate lifetime data with growing, decreasing, and upside down bathtub shaped disintegration rates (SED). In SED, only the mean changes, while the variance stays the same. The loaded and empty containers, containers on decks and hatches and crane operators are the parameters of the SED [9].
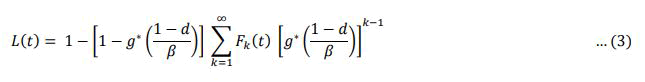
S(t) = P(T >t)=The survival function (t) which is the probability that VVT survives for a time t.
It is known from renewal process that.
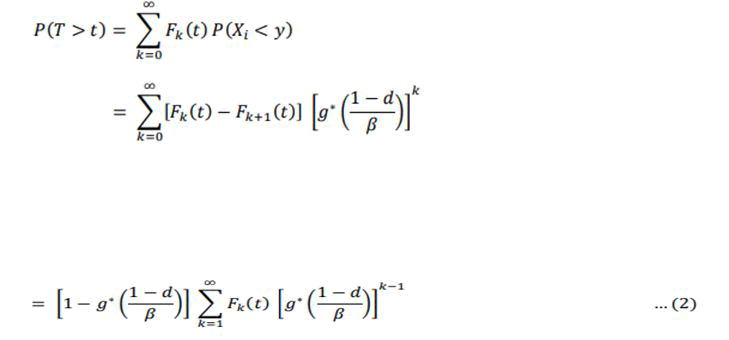
(T<t =(t)=the distribution function of life time (t)
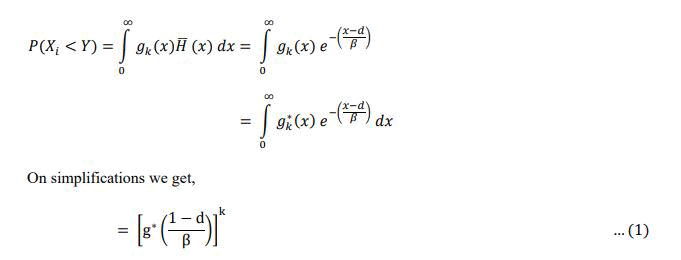
Using convolution theorem for Laplace transforms, Fo(t) = 1 and on simplification, it can be shown that,
Let the random variable with waiting time (c), follows exponentia l with parameter, *(s) (c/c+s) on simplification we get,
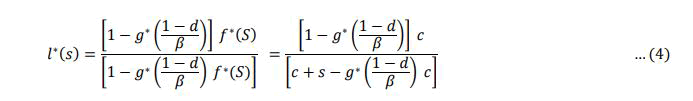
After first and second derivatives on simplification we get the estimated waiting time of VVT through SED as seen in equation (5),
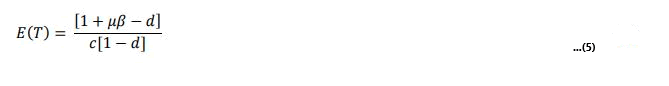
Numerical illustration
The stochastic character of the variables involved in equations (5), modeling as a management tool enables for the modeling of intricate processes that would otherwise be difficult to investigate analytically. The model is used in simulation to calculate the estimated waiting time E(T) as a function of various parameters, allowing for the evaluation of technical and economic options without the need for large capital investments [10]. When μ, β, d is 0.3, 0.5 or 0.7, Table 1 illustrates fixed VVT for varied waiting times, also described in Figure 2. When one parameter VVT is clear and the other two parameters VVT have waiting time clearance, how the expected waiting time behaves is illustrated in Table 2, Figure 3. VVT clearance for two parameters is clear and for one parameter needs waiting time clearance is shown in Table 3 and Figure 4.

Figure 2: Fixed VVT for different waiting time period.

Figure 3: VVT clearance for one parameter at different waiting time period.

Figure 4: VVT clearance for two parameter at different waiting time period.
| c | 0.3 | 0.5 | 0.7 |
|---|---|---|---|
| 0.1 | 11.29 | 15 | 26.33 |
| 0.2 | 5.64 | 7.5 | 13.17 |
| 0.3 | 3.76 | 5 | 8.78 |
| 0.4 | 2.82 | 3.75 | 6.58 |
| 0.5 | 2.26 | 3 | 5.27 |
| 0.6 | 1.88 | 2.5 | 4.39 |
| 0.7 | 1.61 | 2.14 | 3.76 |
| 0.8 | 1.41 | 1.87 | 3.29 |
| 0.9 | 1.25 | 1.67 | 2.93 |
| 1 | 1.23 | 1.5 | 2.63 |
Table 1: Fixed VVT for different waiting time period.
| c | d=0 | β = 0 | μ = 0 |
|---|---|---|---|
| 0.1 | 12.5 | 10 | 10 |
| 0.2 | 6.25 | 5 | 5 |
| 0.3 | 4.17 | 3.33 | 3.33 |
| 0.4 | 3.13 | 2.5 | 2.5 |
| 0.5 | 2.5 | 2 | 2 |
| 0.6 | 2.08 | 1.67 | 1.67 |
| 0.7 | 1.79 | 1.43 | 1.43 |
| 0.8 | 1.56 | 1.25 | 1.25 |
| 0.9 | 1.39 | 1.11 | 1.11 |
| 1 | 1.25 | 1 | 1 |
Table 2: VVT clearance for one parameter at different waiting time period.
| c | μ, β= 0 | d, β = 0 | d,μ = 0 |
|---|---|---|---|
| 0.1 | 10 | 10 | 10 |
| 0.2 | 5 | 5 | 5 |
| 0.3 | 3.33 | 3.33 | 3.33 |
| 0.4 | 2.5 | 2.5 | 2.5 |
| 0.5 | 2 | 2 | 2 |
| 0.6 | 1.67 | 1.67 | 1.67 |
| 0.7 | 1.43 | 1.43 | 1.43 |
| 0.8 | 1.25 | 1.25 | 1.25 |
| 0.9 | 1.11 | 1.11 | 1.11 |
| 1 | 1 | 1 | 1 |
Table 3: VVT clearance for two parameter at different waiting time period.
Results and Discussion
A general description is given of the issue of ship scheduling, where the waiting time of ships in ports is uncertain, as well as the response time. As noted in the Introduction section of the manuscript, marine station operators frequently encounter unpleasant and unpredictable events that cause port congestion, further affecting ships waiting times and port handling times. Scheduling and managing good container terminal operations can reduce waiting times for container ships. Port wait times are not easily predictable for liner companies due to a few common and uncontrollable factors of terminal operations. This negatively affects the marine ecosystem and the simulation results indicate a significant reduction in container vessel waiting times, which may be beneficial for key operations functions and container terminal design. And we showed that it can be used to analyze production time trade offs for alternative mooring policy, different types of vehicles, and changing vessel capabilities [11]. After presenting the results of scenarios with both ships of current size and large ships, we discuss how our analytical model can be applied to assign mooring to live operations. In this case, the AIS data is used to derive the times that ships stay in port initially, after which a prediction model is made to predict the length of time a ship will stay at a particular berth [12].
We developed upper and lower limits of theoretical estimates of throughput times from our model, and provided an extension for the case where the final processing time depends on the quantity of loaded/unloaded containers.
Instead of simply summarizing completion times for all new vessels scheduled during the given time frame, ships already docked in that time frame according to the terminal's operations data are scheduled again by the model in that time frame. Next, vessel arrival data, vessel dimensions, TEU loads, and vessel handling times must be entered into the system.
As ships are restricted by schedule in/after port arrival times. The right hand side of equation (2) represents the total ship turnover time, estimated as the sum of the ships total sailing time, the total expected waiting time for ships in port, and the total expected handling time for ships in port.
Average waiting times for ships at terminals were 9.1, 8.6 and 8.1 hours for larger, medium and smaller vessels. An important fact that caught the attention of station planners was the analysis of RCP indicators by classes of ships. Although port authorities favor larger vessels, there is also a need to focus on smaller vessels in order to improve the terminal's overall capacity. An important aspect regarding berthing decisions such as port expansion is that due to the additional berths to be built outside the peninsula forming spaces, berths are expected to have different handling times, different types of machinery used, and varying distances from container storage yards. As waiting times increase at ports of discharge, container shippers will have a higher risk of delays on time sensitive goods and will be charged for delays in delivery. Transporting the goods in this way may result in additional charges for storage, demurrage and detention, in the event that the truck driver is not able to reach the port terminal on time, due to delays due to weather or strikes during transport.
Conclusion
Therefore a deterministic optimization model is proposed to solve the container slot allocation problems for time sensitive commodities under the dynamics of port congestion pricing. The proposed new pricing mechanism has proven to be effective when compared to a generic slot allocation model that does not take into account shipping time limits and port congestion, with results showing that the proposed pricing scheme can significantly improve ship companies' revenues and improve customer satiation. In terms of reducing carbon emissions from the ship's stay for a longer period at the docks.
References
- Goodchild AV, Daganzo CF (2006) Double-Cycling Strategies for Container Ships and Their Effect on Ship Loading and Unloading Operations. Transp sci 40:473-483.
- Kia M, Shayan E, Ghotb F (2000) The importance of information technology in port terminal operations. Bus Int J Phys Distrib Logist Manage 30:331-344
- Ting JT, Kalmbach B, Chong P, de Frates R, Keene CD, et al. (2018) A robust ex vivo experimental platform for molecular-genetic dissection of adult human neocortical cell types and circuits. Sci Rep 8:1-3.
- De Oliveira GF, Cariou P (2015) The impact of competition on container port (in) efficiency. Transp Res Part A: Policy Pract 78:124-133.
- Budipriyanto A, Wirjodirdjo B, Pujawan IN, Gurning S (2017) A simulation study of collaborative approach to berth allocation problem under uncertainty. Asian J Ship Logist 33:127-39.
- Mishra N (2017) A stochastic model for interterminal container transportation. Transp Sci 51:67-87.
- Sheikholeslami A, Ilati G, Yeganeh YE (2013) Practical solutions for reducing container ships’ waiting times at ports using simulation model. J Mar Sci Appl 12:434-444.
- Ursavas E (2015) Priority control of berth allocation problem in container terminals. Ann of Oper Res 7:1-20.
- Yao Q, Xu L, Zhang Q (2021) Container Slot Allocation for Time-Sensitive Cargo in Maritime Transportation: A One-Phase Model with consideration of Port Congestion. Discrete Dyn Nat Soc 2021:11.
- Amos HM, Jacob DJ, Holmes CD, Fisher JA, Wang Q, et al. (2012) Gas-particle partitioning of atmospheric Hg (II) and its effect on global mercury deposition. Atmos Chem Phys 12:591-603.
- Wang H, Naghavi M, Allen C, Barber RM, Bhutta ZA, et al. Global, regional, and national life expectancy, all-cause mortality, and cause-specific mortality for 249 causes of death, 1980–2015: a systematic analysis for the Global Burden of Disease Study 2015. Lancet 388:1459-544.
- Shabayek AA, Yeung WW (2022) A simulation model for the Kwai Chung container terminals in Hong Kong. Eur J Oper Res 140:1-11.