Spanish
  Chinese
  Russian
  German
  French
  Japanese
  Portuguese
  Hindi
Hindi Research Article, J Fashion Technol Textile Eng S Vol: 0 Issue: 3
Physically Nonlinear Elastic-Viscoplastic Law of Strain of Cotton Yarn under Tension to Breakage
Sultanov KS* and Ismailova SI
Institute of Mechanics and Seismic Stability of Structures of the Academy of Sciences of the Republic of Uzbekistan
*Corresponding Author : Karim Sultanovich Sultanov
Institute of Mechanics and Seismic Stability of Structures of the Academy of Sciences of the Republic of Uzbekistan, Academ-city, Tashkent, Uzbekistan, 100125
Tel: +(871) 262-71-32
Fax: (871) 262-71-52
E-mail: sultanov.karim@mail.ru; sultanov.karim@gmail.com
Received: September 18, 2017 Accepted: October 25, 2017 Published: October 29, 2017
Citation: Sultanov KS, Ismailova SI (2017) Physically Nonlinear Elastic-Viscoplastic Law of Strain of Cotton Yarn under Tension to Breakage. J Fashion Technol Textile Eng S3:006. doi:10.4172/2329-9568.S3-006
Abstract
On the basis of experimental stress-strain diagram, σ(ε), the changes in E modules on strain ε are defined and a complex nonlinear dependence E(ε) is obtained. The method of numerical approximation of obtained dependence E(ε) is offered. With the use of nonlinear dependence E(ε), a physically nonlinear law of strain of cotton yarn under tension is offered. The parameters values of proposed law are determined on the basis of experimental results. Calculated stress-strain diagrams are obtained on the basis of proposed nonlinear law of elastic-visco-plastic strain of yarn. Experimental and theoretical diagrams of σ(ε) are compared. A good agreement is obtained.
Keywords: Cotton yarn; Variable strain modulus; Nonlinear law of tension; Yarn tension; Yarn breakage
Problem Statement and Objectives
Cotton yarn has a complex structure, it consists of cotton fibers 2-5 cm long [1]. Cotton fiber is a non-uniform material and its physical and mechanical, geometric characteristics are not constant over the length [2]. Fiber arrangement relative to the yarn axis also depends on technological process of spinning [1].
A tensile strain in the yarn leads to a gradual change in its complex structure. The arrangement of relative position of the fibers forming the yarn and the twist about the yarn axis are changing. The distance between the fibers, the amount and area of contact surfaces of the fibers change as well. As a consequence, the forces of adhesion and friction, which provide the yarn strength, also change [1].
Because of the large scatter in fiber properties such as thickness, elasticity, viscosity, adhesion coefficient, friction, etc., the structural changes do not occur uniformly along the yarn length. With increase in strain the structural change is localized in the zone of potential damage and breakage of the yarn [1,3]. As shown in [4], during failure of cotton yarn some fractions of the fibers break off and other fractions slip out of the yarn. In addition, cotton fibers and, hence, cotton yarn, possess viscous properties [2,3]. The damage of yarn structure under tension occurs irreversibly; that characterizes the plastic properties [5].
At present, a law of cotton yarn strain considering all above factors does not exist.
The development of the law of cotton yarn strain with consideration of yarn’s complex structure, structural changes under strain, elastic, viscous and plastic properties of the material is an outstanding unsolved problem of the mechanics of deformable bodies.
The aim of present work is to develop a mathematical model (a law) of cotton yarn strain which will take into account its structural damage, elastic, viscous and plastic properties under tension up to failure.
Current State of the Problem
The mechanics of cotton yarn, as one of the branches of the mechanics of textile threads, is developing mainly in two directions.
The first one is a definition and prediction of yarn strength under tension. Tensile strength is determined experimentally [1-3]. Numerous empirical formulae are offered to predict the cotton yarn strength on the basis of experimental results; their analysis is given [3]. The most reliable are the formulae based on the basic research discussed in [2]. Calculated formulae [3] take into account geometric and mechanical characteristics of cotton yarn, mechanical characteristics of fibers, fiber length, inter-fiber friction and geometrical characteristics of fiber arrangement in the yarn, etc.
It is assumed that the fibers in the yarn are arranged on a spiral relative to yarn axis. Inter-fiber frictional forces are determined by the Amonton-Coulomb law. It should be noted that the true geometry of individual fiber arrangement in the yarn is different [1]. The mechanisms of cotton fibers interaction in the yarn under tension and the resulting friction forces (interactions) and their gradual development are not yet fully explored. Nevertheless, theoretical and empirical formulae proposed in [3] are in good agreement with experimental results of the tests on cotton yarn breakage. However, these equations of strength evaluation and prediction are not the laws (models) of cotton yarn strain, and they do not describe the stressstrain state of the cotton yarn under tension.
The second direction in the mechanics of yarn is a development of strain laws and solution of applied problems in textile production. The development of strain laws [2,3,5]. These studies are also based on the experimental diagrams in the form of dependences of tensile force F on longitudinal strain ɛ. Experimental force vs. strain diagrams for cotton yarn have been obtained by many authors [1-6] and these diagrams are nonlinear. Therefore, for applied problems of textile production, the dependence F(ɛ) in most cases is linearized and linear laws are used to describe the mechanical behavior of a cotton yarn [5-10].
The existing elastic, viscoelastic laws of strain in rigid bodies are analyzed and evaluated in terms of their applicability to the textile yarns and threads [3,5]. The laws of hereditary viscoelasticity are considered referring to textile yarns and threads [6].
Based on nonlinear elastic model, the stress-strain state of the yarn is defined [11]. The threads and yarns, as is common in the mechanics of deformable rigid bodies, are considered as solid, homogeneous and isotropic deformable bodies. This leads to a simpler model, but requires idealization of a cotton yarn, which, as already has been stated, has a complex structure. It is noted that to better describe the mechanical behavior of a yarn it is necessary to build a physically nonlinear law of strain. Earlier, the physically nonlinear laws of yarn strain have been proposed based on the Voigt model [5]. In this law the strain modulus and the coefficient of viscosity are presented as the functions dependent on the values of current strain. However, it is known that the Voigt model does not describe the relaxation process of material under strain. A physically nonlinear law of yarn strain is offered on the basis of hereditary viscoelastic models of material [6]. The mechanical characteristics of the yarn are assumed as timedependent. On the basis of existing models of strain in rigid bodies, it is stated, that the generalized Eyring model most reliably describes the rheological properties of material [3]. This model is known as a model of standard linear body.
The stress vs. strain laws in any material are determined by tests. Therefore, this paper starts from obtaining experimental diagrams of cotton yarn in tension.
Materials and Experiments
To carry out the experiments and determine a stress vs. strain diagram of yarn strain under tension, a cotton yarn of carded system was used and it was manufactured in rotor spinning frame from medium staple cotton. In this manufacturing process of cotton yarn the following nominal linear densities of the yarn have been set (number of spools is indicated in parentheses): â = 14.0 (2); 15.4 (2); 16.5 (2); 18.5 (5); 29.0 (16); 50.0 (10); 72.0 (4); 100.0 (3) and 160.0 (1) tex (1 tex = 10–5 ÃÂ/m). In tests the selection of yarn samples with given linear densities was random. Before starting the experiments the linear density of the yarn for each spool was determined separately. To measure the linear density of the yarn with the HM-3 reel, 50 small skeins (leas) 112.5 m long were twisted in automatic mode (100 revolutions of the reel).
After that, twisted samples were weighed in turn on SK-60 H scales. After weighing all skeins, the following data was collected: the date of inspection, lot number, total number of weighed skeins, total linear density of leas in denier, the maximum value, the minimum value, the difference between the minimum and maximum values, average linear density in denier, standard deviation, coefficient of variation (%) and the maximum deviation.
Using results of the measurements of linear density for each spool, the coefficients of variation of linear density roughness (quadratic roughness) were determined. The values of the coefficient of variation Cv for the tested 45 spools of cotton yarn varied from 0.6 to 2%.
Experiments on yarn tension were conducted on «Statimat C» device (Figure 1). The device permits to conduct the tests on yarn breakage in automatic mode using its own software program, untwisting the yarn from the spool and holding in the clamps at a predetermined distance equal to 500 mm. The accuracy of load measuring is 0.1% of the capacity of measuring head (H 100) and the elongation is 0.1% of the given value (100%). Clamping length is 60- 800 mm. Velocity is 100-500 mm/min, the average strain rate of the yarn under tension is about 0.015 s–1 (velocity of mobile clamp is 450 mm/min). The repeatability of the tests is 50 times.

Figure 1: Front panel of «Statimat C» device: (a) global view (b) installation scheme.
1-automated shifter; 2-blow-off nozzle; 3-measuring clam; 4-mobile clam; 5-regulating valve of mobile clam; 6-trash bin; 7-stop button-STOP; 8-emergency stop; 9-main switch; 10-manipulator.
The test results are displayed on computer screen when the device completes the testing of a sample. The data are printed.
Figure 2a shows the diagrams of 50 dependencies of tensile loadstrain F(ɛ) (F in cN, ɛ in %) obtained for the cotton yarn of linear density T=50.0 tex. As shown in Figure 2a, experimental dependences F(ɛ) are nonlinear, and in the process of tension loading, the curvature sign of F(ɛ) changes. At the beginning of loading process in cotton yarn the dependence F(ɛ) has a bulge downward and then upward. Further, the dependence F(ɛ) remains approximately linear.

Figure 2: Experimental diagrams (a), averaged diagram (b) at tension of cotton yarn of linear density â = 50,0 tex.
As already mentioned above, mechanical properties of cotton yarns are determined by their structure. There is an opinion that it is not possible to define the laws of cotton yarn behavior under tension loading, unless the structural composition of the yarn and fiber characteristics (length, yarn length uniformity, inter-fiber friction, how the modulus of individual fibers is translated into yarn modulus, etc.) is taken into account. Mechanical properties of the yarn are quantitatively and qualitatively described by mathematical relationship between stress state (stress tensor), configuration (strain tensor and tensors derived from it) and time. These relations are found from experiments when the yarn is tested under different loads.
The experiment takes into account the internal processes occurring in the yarn under strain. Experimental results or experimental diagram of F(ɛ) is a qualitative and quantitative consequence of these phenomena, including the effect of geometrical and mechanical characteristics of cotton fiber, the inter-fiber friction on the overall strain process in the yarn. In other words, experimental laws of cotton yarn strain F(ɛ) take into account the complex structure of the yarn that consists of staple fibers. The F(ɛ) relationship obtained from the experiments is the consequences of the manifestation of the size effect (fiber length), fiber length uniformity (cross-section variation), strain rate, and how the fiber modulus is translated into the yarn modulus under cotton yarn straining.
The idea is that all physical and mechanical, geometrical properties of the fibers are taken into account by experimental law of yarn tension, i.e., by the F(ɛ) relationship obtained from experiments.
When developing the laws of nonlinear strain in cotton yarn on the basis of the generalized Eyring model it is necessary to define the modulus of strain and internal friction coefficient (volume viscosity) of the yarn. This is done phenomenologically in [5] for the Voigt model. There are two ways of solutions.
The first way (following) [3] is to build the mathematical relationships to determine the yarn modulus through fiber modulus. These relationships should take into account fiber arrangement in the yarn, inter-fiber friction forces, fiber length, yarn length uniformity, etc. There is a number of physical and mathematical difficulties. To overcome these difficulties, some simplifications and the idealization of yarn structure should be assumed.
The second way is to define the strain modulus directly from experimental stress-strain diagram. In this case all fiber properties in the yarn are shown in experiments and are displayed on strain diagrams. Certain strain modules from this diagram are obviously more accurate than the ones obtained in the first case. Therefore, in determining the modulus of cotton yarn strain one should follow the second way.
From F(ɛ) diagram the actual modulus of strain Ef or the secant modulus of strain E can be determined. To determine strain modules Ef and E we would use the averaged dependence F(ɛ) (Figure 2b), which for each series of experiments is automatically given by «Statimat C» device.
To determine Ef the F(ɛ) curve in Figure 2b is divided into 50 intervals with approximately equal step Δɛ. Further, the values of ΔF are determined, corresponding to Δɛ and Ef=ΔF/Δɛ. The value of secant modulus of strain E for the same points of the intervals are determined as E=F/ɛ, where F and ɛ – are the values of longitudinal tensile force and strain in %, on the boundaries of the intervals.
Models of strain, as a rule, are written for the dependences of longitudinal stresses on longitudinal strain σ(ɛ). The strain ɛ in the above expression is a dimensionless quantity, unlike the diagrams shown in Figures 2a and Figure 2b, where it is given in % (ɛ = 10–2 ɛ %).
In order to determine the longitudinal stresses in yarn samples, the relationship σ=F/S is used, where S – is a conventional cross section area of the yarn, which could be determined from formula S=T/ ρv Here ρv– is a volume weight of cotton matter of the fibers (for cotton it is ρv=1,5 mg/mm3). Then strain modulus may be determined from expressions Ef = ΔF ρv/(ΔɛT) and 
These expressions for cotton yarn are reduced to the form: 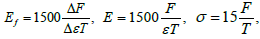 where ΔF and F are in ÑÂN, Δɛ and ɛ – in %. The values of Ef ,E and σ are obtained in ÃÂœPð.
The change in strain modules according to current strain, determined from averaged F(ɛ) curves (Figure 2b), are shown in Figure 3a.

Figure 3: Change in strain modulus depending on strain (a), approximation of the Õ(ε) dependence (b).
In Figure 3 curve 1 relates to changes in actual modulus Ef and curve 2 - to changes in secant modulus E. In both cases, the modules of strain are drastically reduced (compared to initial value) to a certain minimum. Then Ef and E rise to a maximum and drop again. Comparison of dependences Ef (ɛ) and E (ɛ) shows that, in general, the character of their changes is similar. However, Ef (ɛ) changes abruptly while E (ɛ) – more smoothly. Their extreme values differ. The extremes of Ef (ɛ) are greater than the corresponding extremes of E (ɛ).
This is due to the fact that  approximately replaces Ef = dσ/dɛ. So, for further consideration the dependence of secant modulus of yarn strain E (ɛ) is taken as a basis, as, firstly, E (ɛ) varies continuously and stably and, secondly, the determination of function E (ɛ) is more reliable (E=F/ɛ or E=σ/ɛ). Dependence E (ɛ) is shown separately in Figure 3b (curve 1).
Character of changes in strain modulus E (ɛ) (Figure 3b) shows that at the beginning of strain process in cotton yarn, the strain modulus intensively drops from the initial value of EN to the value of Ee, reached at ɛ = ɛe. Then the value of E grows to the maximum value of Em, at ɛ=ɛm. Then there is a drop of modulus E to a value of Ek at ɛ=ɛk. At ɛ=ɛk the breakage of cotton yarn occurs.
A total of 45 F(ɛ) dependences are obtained for the yarn from 45 spools with nine different nominal values of linear density, similar to dependences shown in Figure 2. From 45 averaged dependences F(ɛ), 45 dependences of E(ɛ) are obtained, also similar to the curves in Figure 3. Analysis of dependences E(ɛ) shows that for them the characteristic parameters are the values of strain modules EN, Ee, Em and Ek reached at the values of strain ɛN, ɛe, ɛm and ɛk respectively.
Obviously, nonlinear change in E (ɛ) is the cause of nonlinear dependences F (ɛ,) shown in Figure 2. Yarn tension obtained from experimental diagrams (Figure 2) and change in strain modulus (Figure 3), depending on the strains, allow to some extent to reveal the mechanisms of elastic, elasto-plastic and plastic strain in the yarn under tension.
Approximation of nonlinear dependence of E(ε) and analysis of strain process in the yarn under tension up to breakage
A method for numerical approximation of curve 2 in Figure 3a is offered. The method consists in the fact that using the discrete values of E and ɛ of curve 2 in Figure 3a, all intermediate values of these parameters between two points are defined. As an option, a linear interpolation method could be used. However, in cases where, for example, the interval between two points is large enough, only the extreme points are taken: linear interpolation does not give very accurate values of E and ɛ. Therefore, to determine the value of Ei between two discrete points a and b, the following relationships are proposed
 (1)
(1)
 (2)
(2)
 (3)
(3)
where Ei – is a number of points for which the value of E on the interval [ab] is determined, the parameters with index (a) refer to the initial (first) point, and with index (b) – to the final (last) point of the interval, with index (ab) – throughout the interval; βab– is a dimensionless coefficient of interpolation; its value derived from (1) at ISi=1; ISi– is a parameter characterizing structural change in the yarn on considered approximation interval of function E(ɛ). Structural change in the yarn is taken into account through a change in its strain modulus E depending on strain value of ɛ.
Equation (2) follows from equation (1) at ɛ= ɛb and E=Eb. The value of βab within the considered interval is constant. Note that equation (1) with (2) and (3), as shown by calculations, gives results almost identical to those obtained from linear interpolation. However, equations (1)‒(3) have a better accuracy in approximating the curved portions of E(ɛ) (curve 2, Figure 3a) with few numbers of points.
Figure 3b shows the results of approximation of nonlinear dependence E(ɛ) obtained from experimental data. Conventionally, it is called an experimental curve. Here, curve 1 – is an experimental curve corresponding to curve 2 in Figure 3a. Curve 3 is obtained by approximation of dependence E(ɛ) by equations (1)‒(3) using the extreme values of E and ɛ only, i.e. 4 points: ENɛN; Eeɛe; Emɛmand Ekɛk . In this case, the agreement of approximating and experimental curves is up to 10-20%. Approximating curve 2 is obtained with 10 points, including the extreme ones. Here, three points on the interval [0 ɛe], three points on the interval [ɛe ɛm] and four points on the interval [ɛm ɛk] and intermediate points on specified intervals are taken randomly. Figure 3b shows that in this case, the agreement of experimental and approximating curves is 95-97%. When all 50 points are usedin approximation on experimental curve, curve 1 is obtained. In this case, there is a perfect match of experimental and approximating curves.
As shown above, equations (1)‒(3) can approximate any experimental curvilinear dependence E(ɛ); this permits to create a physically nonlinear law of strain in threads and yarns under tension with variable strain modules, depending on structural changes in material.
Figure 3 shows that the value of E on the interval [ɛN ɛe] decreases rapidly. There occurs a straightening and compaction of fibers under yarn tension [1]. It is assumed that the strain on this interval is reversible and the yarn is strained elastically. At ɛ=ɛe the fibers in the yarn are sufficiently compacted radially. On the interval [ɛe ɛm] under yarn tension the fibers are displaced relative to each other; inter-fiber friction force is growing.
Radial compaction of the fibers continues while strain continues to increase. At ɛ=ɛm the fibers in the yarn are compacted to a maximum and strain modulus reaches its maximum value of Em. Yarn straightening occurs on the interval [ɛe ɛm], hence strain modulus is increasing. It is assumed that a part of relative displacements of fibers in the yarn become irreversible, and on this interval the yarn is elastoplastically strained. Further increase in strain on the interval [ɛmɛk] leads to a yarn breakage. The individual fibers are broken, the yarn starts to lose its strength, strain modulus rapidly drops. At ɛ= ɛk the yarn finally breaks.
Before breakage of the yarn, in the process of damaging its structure, the radial density of yarn is reduced, the force of interfiber friction also decreases. Strain increase leads to a slippage of yarn fibers. Yarn strain on the interval [ɛmɛk] presumably has a plastic character.
At present, there are no results of experiments on yarn tension under unloading on considered intervals of strain. So, elastic, elasticplastic and plastic strain of the yarn on the intervals [ɛN ɛe], [ɛe ɛm] and [ɛmɛk] is an assumption. Specification of these assumptions is an experimental challenge to be studied in the future.
Physically nonlinear law of yarn strain under tension to breakage
Results of the experiments (Figure 1) show that the cotton yarn under tension is strained nonlinearly. Analysis of experimental results shows that under yarn tension the strain modulus varies in a complicated manner (Figure 3). Consideration of changes in strain modulus leads to a development of physically nonlinear law of yarn strain [5]. The nonlinear law of strain should be developed on the basis of linear laws [5]. In particular cases, the nonlinear law should describe the linear process of strain. In contrast to [5], where the Voigt model is taken as a basis, here the generalized Eyring model is considered [2].
Among mechanical models the generalized Eyring model most accurately describes the strain process in materials with rheological properties (creep and relaxation) [3].
In this case, cotton yarn strain with consideration of elastic, plastic and viscous properties of material and structural changes under tension has the form
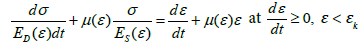 (4)
(4)
 (5)
(5)
where σ– is a longitudinal (axial) tensile stress, ɛ– a longitudinal (axial) strain, t –time, ED (ɛ) – a variable strain modulus under dynamic  tension of the yarn, ES (ɛ) –a variable strain modulus under static
  tension of the yarn, μ(ɛ) – a variable parameter, that accounts for viscous properties of material.
Viscosity parameter μ(ɛ) is related to coefficient of volume viscosity ƞ of the yarn by known relationship [3]
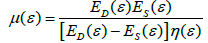 (6)
(6)
The modules of dynamic and static tension are related by the equation
 (7)
(7)
Equations (4) and (5) are physically nonlinear elastic-viscoplastic laws describing strain of cotton yarn under tension. In addition, these laws take into account the strain rate.
Determination and assessment of the values of proposed law parameters
The law of strain (4), (5) comprises the functions of strain modulus change ES (ɛ), ED (ɛ), the function of change in coefficient of volume viscosity ƞ(ɛ) or viscosity parameter μ(ɛ). All of these functions could be determined from the results of appropriate experiments.
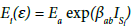
For the analysis and assessment of the proposed law it is necessary to obtain the parameters of these functions. Curvilinear dependence E(ɛ) (curve 1, Figure 3b), obtained from experimental diagram F(ɛ), is taken as a function ES (ɛ). It is obtained at yarn tension rate 
 similar to static function ES (ɛ). Then, using (7) is defined ED (ɛ). For this, it is necessary to know the value of γ. According to the results of experiments [12] for carbon fiber the value is
  at strain rates
  and
and 
In experiments discussed in [12], the lower limit of strain rate 9 s–1 is 600 times greater than the strain rate in that case. The upper limit of strain 61 s–1, is also not a limit strain rate of carbon fiber. Hence, for carbon fiber it can be taken as γ > 1.23. For cotton yarn, which has more pronounced viscous properties than carbon fiber, it can be assumed that γ varies from 1.1 to 4. The exact value of γ could be determined from the relevant experiments.
Unfortunately, there is no experimental data on the values of volume viscosity ƞ(ɛ) or viscosity parameter μ(ɛ) at a strain change in yarn tension from ɛ=ɛN=0 to ɛ=ɛk. Approximate evaluation of ƞ(ɛ) is conducted in the following way.
It is known that the values of the coefficient of volume viscosity ƞ, for structurally undisturbed material are less than for structurally disturbed material. Based on this, assume that the function of the coefficient of volume viscosity of the ƞ(ɛ) under tension in the process of its structure damage increases with increasing strain. Then, according to equation (6) the value of viscosity parameter μ decreases, i.e., the function μ(ɛ) is a decreasing function of its argument ɛ. Assume that viscosity parameter under yarn tension in the range of strain variation 0 ≤ ɛ ≤ ɛk decreases exponentially
 (8)
(8)
where μN – is an initial value of viscosity parameter for structurally undisturbed yarn, α – a dimensionless coefficient, that characterizes the decrease intensity of the value of μ.
At ɛ=ɛk from (8) we get
 (9)
(9)
Hence
 (10)
(10)
With (7) from equation (6) we get
 (11)
(11)
Here the value of ƞ(ɛ) is taken approximately. According to the reference data, volume viscosity of glass is ƞ=105-106 MPa·s, volume viscosity of liquid carbon disulfide at a temperature of 20°C is ƞ=0.576∙10-6 MPa·s, volume viscosity of water at a temperature of 15°Ã¡ is ƞ=3.09∙10-9 MPa·s.
According to these data, volume viscosity of materials varies in a very wide range: from 3.09∙10-9 MPa·s for water to 10-6 MPa·s for glass. Volume viscosity of cotton yarn is about ƞ=102-103 MPa·s at ɛ=0, that is, this coefficient of volume viscosity refers to the unstrained yarn.
Then, with equation (11) at γ=2, EN=3195 MPa and ƞ=102 MPa·s we would get μN =64 s–1. If we assume, that ƞ=103s–1, then μN= 6.4 s–1. Approximately assume that the value of μN changes from μN= 100 s–1 to μN= 1 s–1.Using an estimated value of the parameters of the models (4) and (5) it is possible to analyze the equations of proposed law of yarn strain.
As noted in [13] the coefficient of volume viscosity is a quantitative measure of additional force of internal friction in material. In other words, volume viscosity to some extent characterizes the restructuring of yarn structure. Therefore, the coefficient of volume viscosity ƞ or viscosity parameter μ plays an important role in the process of yarn straining.
On the basis of known values of law parameters (4), consider the change in stresses. For this, in accordance with the experiment, specify the change in strain according to equation
 (12)
(12)
where ɛk – is a critical strain, reached at t=tk, t – time, π–the number of Pythagoras.
Figure 4 (a) shows the change in strain in tensile tests with cotton yarn of linear density T = 50 tex (black dots) and its approximation by equation (13) (solid line). As seen from Figure 4a, the strain changes in experiment and the ones calculated by equation (12) coincide with high accuracy. Yarn strain under tension increases in time almost linearly (Figure 4a). Before the yarn breakage when a certain number of fibers in the yarn has already been torn off, its structure is greatly weakened, the dependence ɛ(t) shows a nonlinear portion as well.

Figure 4: Strain (a), and stress change in time (b) during tension of cotton yarn; comparison of experimental and calculated diagrams in tension (c), dependences σ(ε) at various values of viscosity parameter μN (d).
Calculation of estimated strain value from equation (12) may be carried out with any step Δt. The initial data of the problem are the results of processing of tensile tests with cotton yarn of linear density â = 50 tex: ɛN=0.00025; ɛe=0.00162; ɛm=0.01317; ɛk=0.06202; EN= 3195 Ãœàð; Ee=2130 Ãœàð; Em=4074Ãœàð; Ek=2920 Ãœàð.
Based on these initial data, the function of changes of static modulus of yarn tension ES(ɛ) according to equations (1)‒(3) is determined. From relationship (7) the function of dynamic tension of the yarn is determined ED (ɛ)=γ ES (ɛ). The range of γ changes, as has been shown above, is taken as 1.1 ≤γ≤ 4. The range of changes of initial value of viscosity parameter is 1≤ μN ≤100 s–1.The function μ(ɛ) is determined from the relationship (8). Assume that μN=100 s–1. Further, according to equation (4) and using Finite Difference Method, stress change in time is determined.
Results of Calculations and their Comparison with Experiment
Consider the change in longitudinal stress in the yarn σ(t) under its tension to breakage (Figure 4b). Black shaded points correspond to experimental curve in Figure 2b. Curve 2 is obtained by approximating the experimental dependence E(ɛ) by relationships (1)‒(3) using only the values ɛN, ɛe, ɛm, ɛk, EN, Ee, Em,and Ek, i.e., it is obtained using curve 3 in Figure 3b. In this case, experimental dependences σ(t) coincide quite satisfactorily. Curve 3 is obtained by using the curve 2 of the dependence E(ɛ) in Figure 3b. Approximation of experimental curve in this case is done by ten points. The match of experimental and calculated curves is 98%. In a case when the experimental points in Figure 3b are used in calculations, i.e. when in approximation of experimental dependence E(ɛ) 50 experimental points are used, a 100% match of experimental and calculated dependences of σ(t) is obtained. In these calculations, the initial value of viscosity parameter is μN=100 s–1. Figure 4b shows that after the yarn breakage at ɛ = ɛk, the stress drops instantly to zero.
Excluding time from the dependences ɛ(t) and σ(t) (Figure 4a, 4b) we construct the yarn tension diagram σ(ɛ) (Figure 4c). Here, curves 2-4 correspond to the same designations as in Figure 4b. These curves differ similar to curves 2-4 in Figure 4b, by the number of experimental points at approximation of experimental dependence E(ɛ) by the equations (1)‒(3). Here, as in the case of σ(t) (Figure 4b) with an increase in number of points used at approximation of function E(ɛ) the accuracy of match between experimental and calculated dependences σ(ɛ) is increasing. However, the use of only 4 extreme points of experimental dependence E(ɛ), also gives satisfactory agreement between experimental and calculated curves σ(ɛ) (curves 1 and 2, Figure 4c).
The effect of changes in value μN on dependences σ(ɛ) is shown in Figure 4d. Here, curve 1 corresponds to curve 1 in Figure 4c, which is fully coincides with experimental curve σ(ɛ) at μN =100 s–1. Curve 2 is obtained at μN =10 s–1, and curve 3 at μN =1 s–1. As can be seen, with a decrease in value of yarn viscosity parameter μN, which corresponds to an increase in value of the coefficient of viscosity ƞ according to equation (6), the differences between experimental and calculated dependences σ(ɛ) increase; hence, varying the values μN at known functions ES(ɛ) and ED(ɛ) on the basis of law equation (4) an approximate value of μN can be determined based on comparison between experimental and calculated curves σ(ɛ).
From Figure 4d it is also seen that an increase in value of the coefficient of volume viscosity ƞ (decrease in volume viscosity parameter μ) leads to an increase in stress of yarn breakage (curve 3).
Conclusions
The paper presents a physically nonlinear law of yarn strain under tension to breakage.
The law is developed on experimental diagrams of cotton yarn straining to breakage; these diagrams are obtained on «Statimat C» device. The law is based on a well-known assertion that nonlinear strain properties of the yarn are the consequences of changes in yarn structure under tension. Change in yarn structure leads to a change of its mechanical properties. Hence, complex curvilinear dependences of changes in yarn strain modulus on the value of strain σ (ε ) are obtained from experimental dependences between the yarn’s longitudinal stress and longitudinal strain σ (ε).
The method of numerical approximation of the complex dependence E(ɛ) is developed. On the basis of the generalized Eyring model, a physically nonlinear law of yarn tension is developed, where the strain modules and coefficients of volume viscosity of cotton yarn are obtained as functions of strain. Numerical analysis of the proposed law of yarn strain shows its satisfactory agreement with the results of experiments obtained by stretching the yarn to breakage. Results obtained in the paper show that the proposed physically nonlinear elastic-visco-plastic law describes the nonlinear process of yarn strain under tension and explains the reasons for manifestation of nonlinear properties of material.
Funding
This work was funded by the Fund for Support of Fundamental Research of the Academy of Sciences of the Republic of Uzbekistan (FPFI AS RUz), Number of grants F.12-12 and F.9-14.
References
- Kukin GN, Soloviev AN, Koblyakov AI (1989) Textile Materials Science.
- Morton WE, Hearle JWS (2008) Physical Properties of Textile Fibers. (4th Edtn), Woodhead Publishing Limited, UK.
- Shcherbakov VP (2013) Applied and Structural Mechanics of Fibrous Materials.
- Hearle JWS, Lomas B, Cooke WD (1998) Atlas of Fibre fracture and Damage to textiles. (2nd Edtn), Woodhead Publishing Limited, UK.
- Migushov II (1980) Mechanics of Textile Yarn and Fabrics.
- Makarov AG (2002) Prediction of Strain Processes in Textile Materials.
- Van Langenhove L (1997) Simulating the Mechanical Properties of a Yarn Based on the Properties and Arrangement of its Fibers. Part I: The Finite Element Model. Textil Res J 67: 263-268.
- Van Langenhove L (1997) Simulating the Mechanical Properties of a Yarn Based on the Properties and Arrangement of its Fibers. Part II: Results of Simulations. Textil Res J 67: 342-347.
- Van Langenhove L (1997) Simulating the Mechanical Properties of a Yarn Based on the Properties and Arrangement of its Fibers. Part III: Practical Measurements. Textil Res J 67: 406-412.
- Weiyu He, Shaorui Zhang, Xungai Wang (2001) Mechanical Behavior of Irregular Fibers. Part I: Modeling the Tensile Behavior of Linear Elastic Fibers. Textil Res J 71: 556-560.
- Weiyu He, Xungai Wang, Shaorui Zhang (2001) Mechanical Behavior of Irregular Fibers. Part II: Nonlinear Tensile Behavior. Textil Res J 71: 939-942.
- Jounes A, Sonkarn V, Seidel A, Waldmann M, Cherif Ch et al. (2012) Stress-Strain Behavior of Carbon Filament Yarns under High Strain Rates. Textil Res J 82: 685-699.
- Lukiyanova AS (2015) Fluids Bulk Viscosity: Current and Analytical Conceptions and Prospect of Their Development. Kholodilna tekhnika ta tekhnologia 51: 21-29.