Spanish
  Chinese
  Russian
  German
  French
  Japanese
  Portuguese
  Hindi
Hindi Research Article, J Comput Eng Inf Technol Vol: 12 Issue: 3
Phonocardiogram Signals Segmentation by Using the Hidden Markov Models (HMM)
SM Debbal*, A Atbi, L Hamza Cherif and F Meziani
Department of Electronics, University of Aboubekr Belkaid, Tlemcen, Algeria
*Corresponding Author:SM Debbal, Department of Electronics, University of Aboubekr Belkaid, Tlemcen, Algeria, Tel: 773968524
E-mail: adebbal@yahoo.fr
Received date: 15 June, 2020, Manuscript No. JCEIT-23-13505;
Editor assigned date: 18 June, 2020, PreQC No. JCEIT-23-13505 (PQ);
Reviewed date: 02 July, 2020, QC No. JCEIT-23-13505;
Revised date: 02 January, 2023, Manuscript No. JCEIT-23-13505 (R);
Published date: 30 January, 2023, DOI: 10.4172/2324-9307.1000255
Citation:Debba SM, Atbi A, Hamza Cherif L, Meziani F (2023) Phonocardiogram Signals Segmentation by Using the Hidden Markov Models (HMM). J Comput Eng Inf Technol 12:1.
Abstract
Heart sounds and murmurs provide crucial diagnosis information for several heart diseases such as natural or prosthetic valve dysfunction and heart failure. Many pathological conditions of the cardiovascular system cause murmurs and aberrations in heart sounds. Phonocardiography provides the clinician with a complementary tool to record the heart sounds heard during auscultation. The advancement of intra cardiac phonocardiography, combined with modern digital processing techniques, has strongly renewed researchers’ interest in studying heart sounds and murmurs. This paper presents an algorithm for the detection of heart sounds (the first and second sounds, S1 and S2) and heart murmurs. This paper is concerned to the segmentation of heart sounds by using state of art Hidden Markov Models (HMW) technology which used to extract a smooth envelogram which enable us to apply the tests necessary for temporal localization of heart sounds and heart murmurs. In the scope of this segmentation difficulty the well-known non-stationary statistical properties of Hidden Markov Models (HMW) concerned to temporal signal segmentation capabilities can be adequate to deal with this kind of segmentation problems.
Keywords
Phonocardiogram; Heart sound; Heart murmur; Click; Hidden markov models; Envelope; Segmentation; Algorithm
Introduction
The heart is a principal organ which assures a blood circulation. Under normal conditions, the heart provides two major audible sounds (S1 and S2) for each cardiac cycle [1]. Two other sounds (S3 and S4), with lower amplitude than S1 or S2, appear occasionally in the cardiac cycle by the effect of diseases or age. The first heart sound S1, corresponding to the beginning of ventricular systole, is due to the closure of atrioventricular valves [2]. This sound is composed of two internal components: The Mitral component (M1) associated with the closure of the mitral valve and the Tricuspid component (T1) associated with the closing of the tricuspid valve. The second heart sound, marking the end of ventricular systole and signifying the beginning of the diastole, is made up of two components: The Aortic component (A2) corresponding of the closure of the aortic valve, and the Pulmonary component (P2) corresponding of the closure of the pulmonary valve (Figure 1) [3].

Figure 1: Time representation of the normal phonocardiogram signal.
Valvular pathologies induce significant changes in the morphology of the Phonocardiogram signal (PCG). On the other hand, systolic and diastolic murmurs of different shapes can be added to the PCG signal to build a track resulting from a given disease [4]. The PCG signal is then a support of information to value by digital processing in order to better appreciate the pathologies to can be processed more easily. The energy of the PCG signal can prove therefore very important in the study of the cardiac cycle. In the time domain, such representation allows us to appreciate the length of each heart sound, systolic and diastolic phases and the cardiac cycle [5].
Time frequency analysis and classification of the PCG signals have been studied by several authors. Before any analysis, the PCG signal needs to be segmented into components (sounds or murmurs), and then the components are analyzed separately [6]. Some attempts to segment the PCG signal have been reported in the literature, but the majority of them depend on reference to the Electrocardiogram (ECG) signal, but a major disadvantage of this approach is that the timing between electrical and mechanical activities in a cardiac cycle will not be exactly constant for all patients because of a variety of pathological conditions [7].
The aim of this study is to develop an algorithm for heart sound and heart murmur segmentation using the PCG signal as the only source. PCG signals have internal components of very close frequency bands. Fast Fourier Transform (FFT) provides valuable frequency information, but the timing information is lost during the transformation process. Discrete Wavelet Transform (DWT), in using the band filter during PCG analysis, takes account only of the bandwidth of these filters [8]. In the context of analyzing other methods above, presented a method of heart sounds (S1 and S2) extraction using hilbert transform envelope, which may be applied to real time system for its rapid speed and low complexity, however used this kind of envelope for the extraction of features of heart sounds. The hilbert transform envelope also provides the possibility to analyze the internal components of heart sounds; it’s the only envelope able to detect the S1 and S2 split and extract their internal components [9].
An approach of segmentation of heart sounds and heart murmurs was proposed and that uses the Shannon energy envelope, which is able to delimit the beginning and end of each heart sound with a threshold set from the maximum value of the envelope, to give an appreciation of their average length [10]. Hilbert transform, which may be applied to real time system for its low complexity. Note that this envelope can generate a representation that takes account of the physiological attenuation of heart sounds as well as artifacts of large amplitude while recording the PCG signal, which allows the representation of all heart sounds and heart murmurs [11].
Segmentation refers to the detection of major events in the cardiac cycle, such as the first and second sounds that are audible, pathological noises that can be added to the PCG signal during the systolic and diastolic phases. Several segmentation methods have been developed; some use the ECG signal and the carotid pulse as a reference others are based only on the PCG signal. The majority of these methods are based on the information conveyed by the envelope detection of the PCG signal; where the latter crosses a predefined threshold [12]. These methods include envelope extraction using discrete decomposition and wavelet reconstruction or the use of magnitude of the analytical signal formed using the PCG signal and its transform. Hilbert or by calculating the energy of shannon. However, these methods can lead to several problems such as the lack of low energy events such as the cardiac click which is not always clear by the signal envelope or detection of artifacts at high energy as cardiac activity, or the detection of additional peaks which come from split S2.
A probabilistic method has been proposed in the literature for automatic segmentation of the phonocardiogram signal; it is the Hidden Markov Model (HMM), which is based essentially on the envelope of the homomorphic filtering which makes it possible to generate a smooth envelope facilitating the extraction of the characteristics of the signal showing the entrance to the HMM [13]. The parameters of the model are also estimated from the envelope used, the output of the HMM is the optimal sequence of states which maximizes the probability that the state at time t generates the observation which is the input of the model. Note that the states of the HMM are the areas of interest of the signal like heart sounds. In this paper we will study this method (HMM), trying to improve the characteristics extracted from the homomorphic envelope in order to improve the estimation of the model.
Materials and Methods
Based on this method, we will try in this study to develop an algorithm for separation of heart sounds and heart murmurs; which works by creating the analytic signal of the input by using the Hidden Markov Models (HMM) technology which used to extract a smooth envelogram which enable us to apply the tests necessary for temporal localization of heart sounds and heart murmurs. In the scope of this segmentation difficulty the well-known non-stationary statistical properties of Hidden Markov Models (HMM) concerned to temporal signal segmentation capabilities can be adequate to deal with this kind of segmentation problems [14].
Heart sound hidden Markov model
Theory of the HHM model: An Hidden Markov Model (HMM) is a probabilistic state machine where the states of the machine are unobservable, but the outputs of the state machine are observable. A HMM can model signals where the outputs are discrete or continuous. An example of a discrete HMM is a HMM that models the series of heart sound labels over time. An example of a continuous HMM is a HMM that models the shannon energy feature over time (Figure 2) [15].

Figure 2: Heart sound markov model.
One can model the phonocardiogram signal as a four state HMM. The first state corresponds to the S1 sound, the second state corresponds to the silence during the systolic period, the third state corresponds to the S2 sound, and the fourth state corresponds to the silence during the diastolic period. These four states HMM are useful for modeling the sequence of symbols (or labels) of the phonocardiogram; however, it is too simple to accurately model the transitions between sound and silence. One solution is to embed another HMM inside of each of the heart sound symbol states. The embedded HMM models the signal as it traverses a specific labeled region of the signal. Using this combined approach, we can model both the high level state sequence of our signal (S1-sil-S2-sil) and the continuous transitions of the signal. This type of model is similar to how a speech processing system has a high level probabilistic grammar to model the transition of words or phonemes, and an embedded HMM for each phoneme.
All of the experiments utilized an eight state HMM for the S1 sounds, a six state HMM for the S2 sound, and a three state HMM for each silence period. The number of states where calculated by taking the average duration of each heart sound and dividing by the frame duration. For example, the S1 sound has an average duration of 160 milliseconds and the frame step size is 20 milliseconds; therefore, it can be represented by eight states (160 ms/20 ms=8). In addition, the experiments utilized a four state grammar that represented the state model. The probabilities for this model were learned using a discrete HMM where the label files were used to train the model. The resultant HMM represents the symbol transitions of the phonocardiogram. We manually translated the discrete HMM into a grammar for use with the HTK toolset.
Two different methods for measuring the performance of the system are employed: Frame error rate and model error rate. To determine the frame error rate, we compare each frame of the labeled signal to the output signal. We calculate the error rate of the system by dividing the number of mismatched frames by the total number of frames in the system. To determine the model error rate, we calculate the center of the heart sound label and the center of the learned heart sound and calculating the difference between these centers. The system marks a labeling as a success if the delta between these centers is less than 50 milliseconds. Then, the error rate is the number of mismatched S1 or S2 labels divided by the total number of sound labels in the system. We measure both the frame error rate and the model error rate, for both the training of the system and the validation of the system. Since there were only clean files for eight of the patients, eight fold cross validation was used. Finally, the noisy files were validated against the model where the model was trained with only clean files.
Optimal path calculation: Viterbi algorithm: The viterbi algorithm is named after andrew viterbi, who proposed it in 1967 as a decoding algorithm for convolutional codes over noisy digital communication links. It has, however, a history of multiple inventions, with at least seven independent discoveries. For example, in statistical parsing a dynamic programming algorithm can be used to discover the single most likely context free derivation (parse) of a string, which is commonly called the "viterbi parse". Another application is in target tracking, where the track is computed that assigns a maximum likelihood to a sequence of observations. The idea is to use a reestimation procedure which gradually refines the model according to the following steps:
• Choose an initial set Λ0 of parameters
• Calculate Λ1 from Λ0, then Λ2 from Λ1, etc
• Repeat this process until an end criterion
For each learning step P, we have Λp and we look for a Λp+1 which must verify:

It is now a question of determining the best path corresponding to the observation, that is to say of finding in the model Λ the best sequence of states Q, which maximizes the quantity P (Q, O | Λ).
To find Q=(q1, q2,..., QT) for a sequence of observations O = (O1, O2,...,OT), we define the intermediate variable δt (i) as the probability of the best path leading to the state if at time t, being guided by the first t observations.

By recurrence, we calculate:

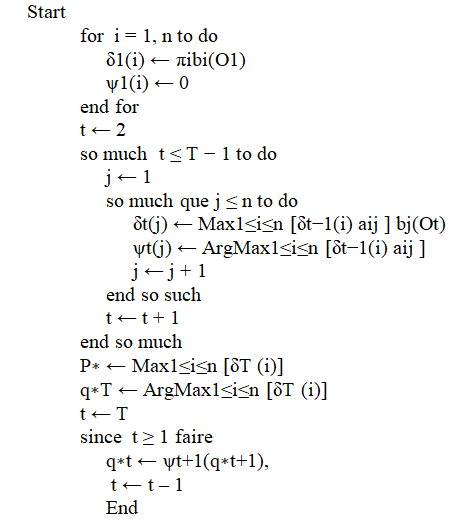
By keeping track, during calculation, of the state sequence which gives the best path. We use a variant of dynamic programming, the Viterbi algorithm to formalize this recurrence. It provides as output the value P* of the probability of the emission of the sequence by the best sequence of states (q*1, • • •, q*T). The argmax function allows you to store the index i, between 1 and n, with which you reach the maximum of the quantities (δt(i) aij)). The cost of operations is also in Θ (n2T).
Viterbi algorithm:
Results and Discussion
Analysis of the signal PCG by using the HHM model: Results
The following organogram describes the different stages of segmenting PCG signals using the HMM model (Figures 3-7).

Figure 3: PCG signal segmentation algorithm by using the HHM model.

Figure 4: Segmentation of normal PCG signals. Note: a) Normal signal PCG; b) Standardized envelope by using homomorphic filtering; c) Localization of S1 and S2 by HMM; d) Sound S1; e) Sound S2

Figure 5: Segmentation of pathological Signal PCG case « MP): Mitral Prolopase. Note: a) Pathological signal PCG (MP); b) Standardized envelope by using homomorphic filtering; c) Localization of S1 and S2 by HMM; d) Sound S1; e) Sound S2

Figure 6: Segmentation of pathological Signal PCG case « OS): Opening Snape. Note: a) Pathological Signal PCG (OS); b) standardized envelope by using homomorphic filtering; c) localization of S1 and S2 by HMM; d) sound S1; e) Sound S2

Figure 7: Segmentation of pathological signal PCG case « AS »: Aortic Stenosi. Note: a) Pathological signal PCG (AS); b) Standardized envelope by using homomorphic filtering; c) Localization of S1 and S2 by HMM; d) Sound S1; e) Sound S2
Our HMM hidden Markov model applied to the different PCG signals is defined by 4 states: S1 and S2 sounds and the systolic and diastolic phases which can be silent or which can correspond to different heart murmurs. The envelope resulting from homomorphic filtering, we allow to extract the best characteristics of the PCG signal for a better observation sequence.
Given the following observation, we can determine the parameters of the Markov model Λ={aij, μj, j, πi}. Therefore, we can establish the best state sequence by applying the Viterbi algorithm. The durations of heart sounds S1 and S2 as well as the systolic and diastolic phases were well estimated. Table 1 provides the segmentation results of the PCG signals by using the HMM technic.
Table 1: Durations of the sound S1, S2 and systolic and diastolic phases.
The PCG signals with murmur contain S1 sounds which have a duration greater than that of B2 sound, as well as shorter systolic phases than diastolics. The application of HMM has given satisfactory results for the discrimination of the different components of PCG signals. A vigorous determination of the HMM parameters generates a clear segmentation of the PCG signals, this allows us directly to access the durations of the various components of the signal. Our HMM made it possible to segment a large number of PCG signals with global decision without the obligation to use thresholds, however; it should also be noted that this algorithm is incapable of segmenting certain PCG signals.
Conclusion
The main objective of the work described in this paper was to develop a robust segmentation technique for segmenting the phonocardiogram into its main components HMM’s PCG signal segmentation method generates excellent results, especially for pathological signals with complex murmur morphology. The use of the homomorphic envelope is very important for the extraction of the characteristics which present the Markov model. It is a method that eliminates pathological noises or sometimes attenuates them by comparing them to that of the sounds S1 and S2 which favors the maximization of probability of generating the best sequence of states.
References
- Pourazad M, Moussavi Z, Farahmand F, Ward R (2005) Heart sounds separation from lung sounds using independent component analysis. Conf Proc IEEE Eng Med Biol Soc 3: 2736-2739.
[Crossref] [Google Scholar] [PubMed]
- Lehner RJ, Rangayyan RM (1987) A three channel microcomputer system for segmentation and characterization of the phonocardiogram. IEEE Trans Biomed Eng 34: 485-489.
[Crossref] [Google Scholar] [PubMed]
- Sepehri AA., Gharehbaghi A, Dutoit T (2010) A novel method for pediatric heart sound segmentation without using the ECG. Comp Method Prog Biomed 99: 43-48.
[Crossref] [Google Scholar] [PubMed]
- Vivek N, Roland P (2005) Accessing heart dynamics to estimate durations of heart sounds. IOP Publ Ltd Physiol Meas 26: 1005-1018.
[Crossref] [Google Scholar] [PubMed]
- HAMZA CHERIF L, Debbal SM, Bereksi-Reguig F (2008) Segmentation of heart sounds and heart murmurs. J Mech Med Biol 8: 549-59.
- Zhihai Tu, Guitao Cao (2010) Improved methods for detecting main components of heart sounds. Six Int Conf Natural Comput Shang Dong Yantai.
- Hu XJ, Zhang JW, Cao GT, Zhu HH, Li Hao (2011) Feature extraction and choice in pcg based on hilbert transfer. 4th Int Cong Image Signal Proces (IEEE) 4: 2159-2163.
- Hamza CL, Debbal M (2013) Algorithm for detection of the S1 and S2 split and extraction of their internal components using a Hilbert transform. J Med Eng Technol.
[Crossref] [Googlescholar] [PubMed]
- Lehner RJ, Rangayyan RM (1987) A three-channel microcomputer system for segmentation and characterization of the phonocardiogram. IEEE Trans Biomed Eng 34: 485-489.
[Crossref] [Google Scholar] [PubMed]
- Groch MW, Domnanovich JR, Erwin WD (1992) A new heart sounds gating device for medical imaging. IEEE Trans Biomed Eng 39: 307-310.
[Crossref] [Google Scholar] [PubMed]
- Huiying L, Sakari L, Liro H (1997) A heart sound segmentation using wavelet decomposition and reconstruction. Proceed 19th Annual Int Confer IEEE-EMBS, Chicago, pp. 1630-1633.
- Sarkady AA, Clarck RR, Williams R (1976) Computer analysis techniques for phonocardiogram diagnosis. Comput Biomed Res 9: 349-63.
[Crossref] [Google Scholar] [PubMed]
- Atbi S, Debbal M, Meziani F, Meziane A (2013) Separation of heart sounds and heart murmurs by Hilbert transform Envelogram. J Med Eng Technol 37: 375-387.
[Crossref] [Google Scholar] [PubMed]
- Liang H, Lukkarinen S, Hartimo I (1997) A boundary modification method for heart sound segmentation algorithm. Comp Cardiol 25: 593-595.
- L. Hamza Cherif (2008) Segmentation of heart sounds and heart murmurs. J Mech Med Biol 8: 4.