Research Article, J Phys Res Appl Vol: 5 Issue: 5
Multi-Gamma Shielding Parameters for Some Heavy Metal Oxide Glasses by MCNP in Comparison with XCOM and Available Experimental Data
Nassreldeen. A.A. Elsheikh*
Department of Physics, Al-Baha University, College of Science&Arts, Al-Mikhwah, P.O. Box 1988, Al-Baha, Saudi Arabia
- *Corresponding Author:
- Nassreldeen. A.A. Elsheikh
Department of Physics,
Al- Baha University,
College of Science&Arts,
Al-Mikhwah,
P.O. Box 1988,
Al-Baha,
Saudi Arabia,
Tel no: 00966503429375;
E-mail: nassreldeen.elsheikh@yahoo.com
Received date: August 08, 2021; Accepted date: November 16, 2021; Published date: November 29, 2021
Citation: Elsheikh NAA (2021) Multi-Gamma Shielding Parameters for Some Heavy Metal Oxide Glasses by MCNP in Comparison with XCOM and Available Experimental Data. J Phys Res Appl 5:5
Abstract
A simple Monte Carlo (MCNP) geometrical design was modeled to characterize the mass attenuation coefficient (μ/ρ), Mean Free Path (MFP) and Half-Value Layer (HVL) for six glass samples of (PbO-Li2O-B2O3) system that were previously prepared by others. The (μ/ρ) values were calculated at twenty gamma energy lines covering the range (0.107-7.12) MeV. The MCNP values of (μ/ρ) were compared with those of XCOM and available experimental data, and good agreement was concluded. The effect of PbO concentration on the simulated values of μ/ρ, MFP and HVL was calculated and compared with available experimental data at gamma energy range (0.356-1.332) MeV. The results showed that Pb concentration effect follows a trend similar to that observed in the available experimental literature.
Keywords: Monte Carlo simulations; XCOM; heavy metal oxide glasses; gamma shielding parameters
Introduction
The computing and/or measuring of gamma-ray shielding parameters such as mass attenuation coefficient μ/ρ (cm2.g-1), half value layer HVL (cm) and Mean Free Path MFP (cm) play important role in the research area of radiation physics [1]. Mass attenuation coefficient is the most commonly used parameter to study the interaction of gamma radiations [2-6]. This interaction is the combination of the partial photoelectric absorption, Compton scattering and pair production which are energy and atomic number dependent. The photoelectric absorption and pair-production are the processes by which photon completely removed whereas Compton interaction slows down photon energy sufficiently to be removed by photoelectric absorption interaction [4]. Thus, μ/ρ is the most important quantity characterizing shield design and it is a basic factor for deriving other gamma ray shielding parameters such as MFP and HVL.
Concretes are commonly used as shielding materials in nuclear reactors for several types of nuclear radiations [1, 7-8]. However, concretes as shielding materials in nuclear reactors suffer from several limitations including, continuous modification of the shielding properties due to addition of moisture content, opaqueness to visible light and thus, it is not possible to see through concrete based shield, the crack formation occurs after long exposure to nuclear radiations and aging and loss of water occurs in the concrete-based shield due to nuclear radiations-induced heat generated at concrete [1, 9].
Different configurations of heavy metal oxide glass systems have been investigated as possible alternatives of concretes for gamma ray shielding purposes and several gamma transmission geometries have been developed [4, 10-14]. Heavy metal oxide glasses are transparent to visible light and their chemical composition can be varied widely to attenuate several types of the nuclear radiations originating in the nuclear reactors [1]. The transparent feature of the heavy metal oxide glasses make them useful for optical windows in nuclear reactors and isotope technology centers.
In the light of these efforts, Ashok kumar [15] has measured the μ/ρ values for six glass samples of composition (0.6-x) PbO-x Li2O-0.40 B2O3 (where 0 ≤ x ≤ 0.25 mol%) at photon energies; 0.356, 0.662, 1.173 and 1.332 MeV in a narrow beam geometrical set-up. The measured μ/ρ values were then used to obtain the values of MFP, effective atomic number and electron density. The shielding capabilities of the prepared glasses have also been compared with standard concretes as well as with the standard shielding glasses. It is found that the prepared glasses are the better shielding alternative to the conventional concretes as well as other standard shielding glasses with the most effective shielding properties observed for the sample of chemical formula (Pb3B4O9).
However, the four energy lines used in [15]; 0.356, 0.662, 1.173 and 1.332 MeV, do not represent all the expected energies of gamma rays that could be utilized to examine the gamma shielding capabilities of the prepared glass samples. In addition, the energy range of gammaray photons in a reactor was found to be (0.10-10) MeV during uranium fission [3]. Therefore, it is essential to have μ/ρ values for photon energies that suit such range. On the other hand, HVL is one of the basic gamma shielding parameters that could to utilize to determine the shield design, however it is missing in [15]. This work addresses such shortcomings.
The MCNP radiation transport code can in principle provide the highest accuracy and precision in modeling of the physical interactions in a matter, applied in circumstances often not available for experimental measurements. Reported literature ([2, 4, 16-19], reveals that MCNP is an effective tool to simulate gamma transmission geometries and calculate μ/ρ values for different types of compounds or mixtures.
On the other hand, The XCOM [20] computer program is usually employed for theoretical estimation of μ/ρ values and interaction cross-sections for elements, compounds, and mixtures. The XCOM program calculates the μ/ρ values at gamma energy range (1KeV-100) GeV using the Hartree-Slater central potential theory and it has been verified experimentally that it gives results close to experimental ones [21-22].
On the basis of such considerations, Monte Carlo radiation transport code MCNP5 [23] was employed to model a simple gamma transmission geometry suitable for exploring the gamma shielding features for the six glass samples of (PbO-Li2O-B2O3) system that were previously prepared by Kumar [15]. The geometrical model was utilized to determine the μ/ρ values at twenty gamma energy lines; 0.107, 0.114, 0.122, 0.139, 0.159, 0.170, 0.182, 0.208, 0.238, 0.254, 0.271, 0.276, 0.356, 0.511, 0.662, 0.835, 1.173, 1.275, 1.332 and 7.12 MeV. These energies cover a reasonable range for exploring gamma shielding capabilities of the simulated glass samples and suit the energy range of gamma rays present in nuclear reactors during uranium fission (0.10-10) MeV [3]. In addition, the XCOM program was employed to calculate of the μ/ρ values at the same energy range (0.107-7.12) MeV. This is to examine the applicability of the proposed geometry for gamma transmission predictions.
The experimental values of MFP reported by Kumar in [15] were used to derive the HVL values for the six glass samples at the four considered gamma energy lines; 0.356, 0.662, 1.173 and 1.332 MeV. The derived values of HVL, in addition to the available experimental data for μ/ρ and MFP, may provide sufficient data for comparison with the MCNP simulations with respect to the same gamma shielding parameters. Furthermore, the effect of the PbO concentration on the simulated values of μ/ρ, MFP and HVL was also investigated and compared with available experimental results at gamma energy range (0.356-1.332) MeV.
Materials and Methods
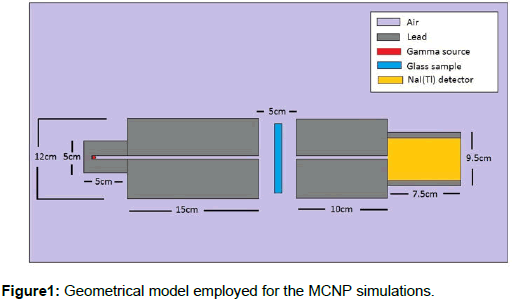
The MCNP simulated gamma attenuation geometry is shown in Fig. 1.
The model consists of a cylindrical lead (Pb) capsule of 1cm inner diameter, 5cm outer diameter, 4cm length for the cavity, and 5cm length for the Pb capsule. The Pb capsule contains the gamma source which is considered as a mono-energetic isotropic point source in infinite medium.
The source strength is assigned to unity to represent a normalized source and the MCNP code was executed in photon transport mode only. The photon weight factor is 1 in all cells and zero in the cutoff region (outside the boundary surface of the problem).
The initial gamma rays coming from the source were collimated by a cylindrical lead collimator of 1cm inner diameter, 12cm outer diameter and 15 cm length. The glass sample was simulated as a cylinder with 10 cm diameter and 0.7 cm thickness and located at 2.15cm along the X-axis away from both gamma source and NaI(Tl) detector collimators.
The transmitted photons were collimated by a cylindrical lead collimator of 1cm inner diameter, 12cm outer diameter and 10 cm length. For counting the intensity (I) of the transmitted photons, a 7.5 cm×7.5 cm NaI (Tl) detector was modeled and shielded with a cylindrical Pb collimator of 1cm thickness.
The flux over detector cell (F4) was selected to estimate the transmitted flux in the NaI(Tl) detector cell. The simulated glass samples were targeted by photons with energies; 0.107, 0.114, 0.122, 0.139, 0.159, 0.170, 0.182, 0.208, 0.238, 0.254, 0.271, 0.276, 0.356, 0.511, 0.662, 0.835, 1.173, 1.275, 1.332 and 7.12 MeV.
The number of histories was 107 and cross sections were obtained from the ENDF/B-VI, and the NJOY libraries. The simulated results pass all statistical checks and have relative error less than 0.3% for all glass samples under study.
The transmitted intensity (I) and the initial intensity (Io) of photons were calculated with and without glass sample, respectively. The individual densities and thicknesses of simulated glass samples were taken from [15].
It is worth noting that, the individual thicknesses were averaged to be 0.7cm and considered for each glass sample. The MCNP simulation has been repeated for each glass sample and the μ/ρ values for the six prepared glass samples were derived from their linear attenuation coefficients μ (cm-1).
The mole fractions, chemical formulas, densities and thicknesses of the investigated glass samples are given in Table 1 [15].
| Sample | Mole fractions | Chemical formula | Density | Thickness (cm) | ||
|---|---|---|---|---|---|---|
| PbO | Li2O | B2O3 | (g.cm-3) | |||
| Sample (1) | 0.6 | 0 | 0.4 | Pb3B4O9 | 6.306 | 0.741 |
| Sample (2) | 0.55 | 0.05 | 0.4 | Pb11B16Li2O36 | 6.144 | 0.712 |
| Sample (3) | 0.5 | 0.1 | 0.4 | Pb5B8Li2O18 | 5.786 | 0.648 |
| Sample (4) | 0.45 | 0.15 | 0.4 | Pb9B16Li6O36 | 5.553 | 0.659 |
| Sample (5) | 0.4 | 0.2 | 0.4 | Pb2B4Li2O9 | 5.378 | 0.756 |
| Sample (6) | 0.35 | 0.25 | 0.4 | Pb7B16Li10O36 | 5.138 | 0.684 |
Table1: The mole fractions, chemical formulas, densities and thicknesses of the investigated glass samples [15].
Using XCOM software requires the knowledge of the mass fractions of the constituent compounds for each glass sample. Therefore, the mole fractions of PbO, Li2O and B2O3 for each glass sample were converted into mass fractions using the formula

Where, (g) is the mass fraction of one constituent compound. The term () is the mass (g) of the constituent compound, consisting of its mole fraction (mole) and molar mass (g.mole-1). While the term represents the total mass (g) of the mixture.
The mass fractions of the constituent compounds for each glass sample were inserted in the XCOM data base program to determine the theoretical μ/ρ values at gamma energy range (0.107-7.12) MeV. It is worth noting that, as well as μ/ρ values, the XCOM software generates the elemental mass fractions for each glass sample.
These elemental mass fractions are required to specify glass sample materials (by mass fraction) in the MCNP input files. Thus, the MCNP simulations were carried out for each glass sample by employing the XCOM analysis results with respect to the elemental mass fractions of that sample. The linear attenuation coefficient μ (cm-1) of the glass samples under investigation is defined from the exponential attenuation rule for narrow, monochromatic rays for thin absorbing material [4].

The total mass attenuation coefficient values μ/ρ (cm2.g-1) for multi-element materials are the sum of the (μ/ρ)i values of each element by using mixture rule [4].

Where wi is the weight fraction and (μ/ρ)i is the mass attenuation coefficient of the ith constituent element.
The values of μ were used to determine MFP and HVL for each glass sample. The Mean free path MFP (cm) is the thickness of the shielding materials for two successive collisions and was calculated in [3] as

While the Half Value Layer, HVL (cm) is the thickness of the shielding materials which reduces photon density by 50% of the incident. The HVL is expressed in unit of length as [24].

Based on equation (5), the values of the HVL to be compared with those obtained by MCNP simulations were derived by multiplying the measured values of MFP for the six prepared glass samples by (ln(2)=0.693).
Results and Discussion
The MCNP values of μ/ρ for the six simulated glass samples were compared with those theoretically calculated by XCOM and with available experimental results reported by Kumar in [15]. The data was organized and presented in Table 2.
| Energy (MeV) |
Mass attenuation coefficients (cm2.g-1) | |||||||||||||||||
|---|---|---|---|---|---|---|---|---|---|---|---|---|---|---|---|---|---|---|
| Sample (1) | Sample (2) | Sample (3) | Sample (4) | Sample (5) | Sample (6) | |||||||||||||
| MCNP | XCOM | EXP | MCNP | XCOM | EXP | MCNP | XCOM | EXP | MCNP | XCOM | EXP | MCNP | XCOM | EXP | MCNP | XCOM | EXP | |
| 0.107 | 3.7151 | 3.663 | 3.6251 | 3.575 | 3.5241 | 3.474 | 3.4251 | 3.36 | 3.2921 | 3.227 | 3.1361 | 3.071 | ||||||
| 0.114 | 3.1056 | 3.099 | 3.1016 | 3.025 | 2.9476 | 2.94 | 2.8516 | 2.844 | 2.7466 | 2.732 | 2.6165 | 2.602 | ||||||
| 0.122 | 2.6705 | 2.625 | 2.6085 | 2.563 | 2.5376 | 2.492 | 2.4366 | 2.411 | 2.3426 | 2.317 | 2.2336 | 2.207 | ||||||
| 0.139 | 1.9016 | 1.891 | 1.8576 | 1.847 | 1.8076 | 1.797 | 1.7506 | 1.74 | 1.6836 | 1.673 | 1.6064 | 1.596 | ||||||
| 0.159 | 1.3847 | 1.369 | 1.3437 | 1.338 | 1.3157 | 1.302 | 1.2747 | 1.262 | 1.2277 | 1.215 | 1.1725 | 1.16 | ||||||
| 0.17 | 1.1774 | 1.165 | 1.1514 | 1.139 | 1.1214 | 1.109 | 1.0874 | 1.076 | 1.0474 | 1.036 | 1.0017 | 0.9903 | ||||||
| 0.182 | 1.0198 | 0.9931 | 0.988 | 0.9713 | 0.9732 | 0.9465 | 0.9449 | 0.9181 | 0.912 | 0.8852 | 0.8735 | 0.8467 | ||||||
| 0.208 | 0.7495 | 0.7287 | 0.7411 | 0.7133 | 0.7167 | 0.6959 | 0.6968 | 0.676 | 0.6737 | 0.6529 | 0.6466 | 0.6258 | ||||||
| 0.238 | 0.5542 | 0.541 | 0.5455 | 0.5303 | 0.5312 | 0.518 | 0.5232 | 0.504 | 0.507 | 0.4878 | 0.4881 | 0.4689 | ||||||
| 0.254 | 0.4738 | 0.4689 | 0.4658 | 0.4599 | 0.4545 | 0.4496 | 0.4428 | 0.4379 | 0.4342 | 0.4243 | 0.4183 | 0.4084 | ||||||
| 0.271 | 0.4148 | 0.4082 | 0.4132 | 0.4006 | 0.4009 | 0.392 | 0.3911 | 0.3822 | 0.3807 | 0.3708 | 0.3674 | 0.3575 | ||||||
| 0.276 | 0.4148 | 0.4082 | 0.4132 | 0.4006 | 0.4009 | 0.392 | 0.3911 | 0.3822 | 0.3807 | 0.3708 | 0.3674 | 0.3575 | ||||||
| 0.356 | 0.2501 | 0.2436 | 0.24 | 0.2456 | 0.2399 | 0.235 | 0.2406 | 0.2357 | 0.233 | 0.2349 | 0.2309 | 0.228 | 0.2285 | 0.2253 | 0.22 | 0.2213 | 0.2188 | 0.215 |
| 0.511 | 0.1451 | 0.1397 | 0.1432 | 0.1383 | 0.1411 | 0.1367 | 0.1387 | 0.1348 | 0.1361 | 0.1327 | 0.1331 | 0.1302 | ||||||
| 0.662 | 0.1045 | 0.1022 | 0.101 | 0.1042 | 0.1015 | 0.1 | 0.1028 | 0.1007 | 0.0995 | 0.1015 | 0.0998 | 0.0985 | 0.1 | 0.0987 | 0.0971 | 0.0986 | 0.0975 | 0.0968 |
| 0.835 | 0.0828 | 0.081 | 0.0821 | 0.0806 | 0.0814 | 0.0802 | 0.0806 | 0.0797 | 0.0798 | 0.0792 | 0.079 | 0.0786 | ||||||
| 1.173 | 0.0611 | 0.0608 | 0.0601 | 0.0609 | 0.0607 | 0.0598 | 0.0608 | 0.0606 | 0.0598 | 0.0607 | 0.0605 | 0.0594 | 0.0605 | 0.0603 | 0.0591 | 0.0603 | 0.0601 | 0.0589 |
| 1.275 | 0.0581 | 0.0573 | 0.0579 | 0.0573 | 0.0576 | 0.0572 | 0.0573 | 0.0571 | 0.057 | 0.0569 | 0.0569 | 0.0568 | ||||||
| 1.332 | 0.0563 | 0.0557 | 0.0551 | 0.056 | 0.0556 | 0.0549 | 0.0558 | 0.0556 | 0.0548 | 0.0556 | 0.0555 | 0.0546 | 0.0555 | 0.0554 | 0.0542 | 0.0553 | 0.0552 | 0.0539 |
| 7.12 | 0.0433 | 0.0403 | 0.0426 | 0.0398 | 0.0419 | 0.0393 | 0.0411 | 0.0387 | 0.0402 | 0.038 | 0.0392 | 0.0372 | ||||||
Table2: The MCNP, XCOM and available experimental data [15] of μ/ρ for the six glass samples at gamma energy range (0.107-7.12) MeV.
It is seen from Table 2 that μ/ρ of each glass sample decreases sharply in the low energy region (0.107-0.356) MeV. This may be attributed to the photoelectric effect which predominates at E < 0.4 MeV [25]. The μ/ρ values are then following a stepwise reduction in the higher energy region (0.356-7.12) MeV for all considered glass samples. This may be attributed to the fact that, Compton scattering and the pair production are the predominant reactions in the ranges 0.4 MeV < E < 1.330 MeV and E ˃1.02, [24, 25].
As a measure of the agreement, the percentage relative differences RD(%) between (MCNP and XCOM), and (MCNP and experiment) with respect to the values of μ/ρ were calculated for all considered glass samples at gamma energy ranges; (0.107-7.12) MeV and (0.356-1.332) MeV, respectively. The average of the RD (%) values for each glass sample was calculated and the results are presented in Table 3. As seen in Table 3, the averaged RD (%) between (MCNP and, XCOM), and (MCNP and experiment) μ/ρ values are very small and fall in the ranges (1.93-1.77) %, and (2.79-2.38) %, respectively.
| Sample | RD (%) | RD (%) |
|---|---|---|
| (MCNP-XCOM) | (MCNP-EXP) | |
| Sample (1) | 1.9306 | 2.7889 |
| Sample (2) | 2.1037 | 3.0293 |
| Sample (3) | 1.8059 | 2.4514 |
| Sample (4) | 1.751 | 2.4583 |
| Sample (5) | 1.7879 | 2.8191 |
| Sample (6) | 1.7684 | 2.3814 |
Table3: Average of relative differences RD(%) between (MCNP and XCOM) and (MCNP and experiment) values of μ/ρ.
Thus, satisfactory agreement is achieved and one may conclude that the narrow beam geometry employed is suitable for estimating the μ/ρ values for the six glass samples under investigation. Discrepancy in the values of μ/ρ obtained by MCNP and the experiment could be attributed to the deviations from narrow beam geometry in the source detector arrangements presented in [15].
While variation in the values of MCNP and XCOM, may be due to different nature of the two employed techniques and the expected differences between the respective databases that considered for each method, as well as the statistical uncertainties in MCNP results which were reported as, less than 0.3%.
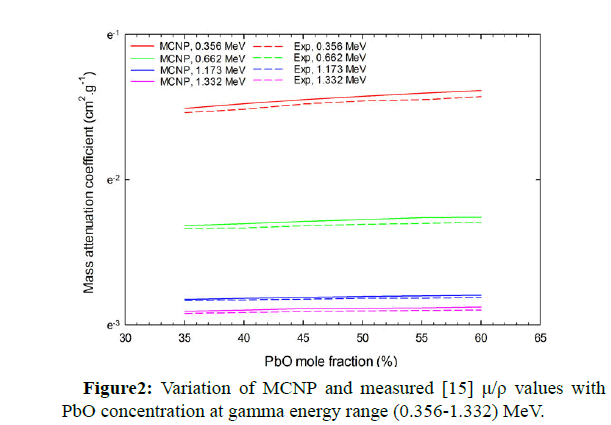
The effect of PbO concentration (mole fraction %) on the μ/ρ parameter was also investigated. Fig. 2 shows the variation of simulated and experimentally measured μ/ρ values with PbO contribution at the four gamma energy lines; 0.356, 0.662, 1.173 and 1.332 MeV.
As seen in Fig.2, Both simulated and measured μ/ρ values increase as PbO concentration increases and decrease as photon energy increases with best gamma shielding capabilities achieved for the sample (1) of the chemical formula (Pb3B4O9) with 60% PbO at 0.356 MeV. Our results with respect to the variation of simulated μ/ρ values with incident photon energy tabulated in Table 2, and with the PbO concentration presented in Fig. 2, are in consistency with those obtained by Kumar [15].
The results with respect to the variation of both simulated and measured μ/ρ values with incident photon energy as well as with PbO concentration implied that if the energy of the incident photons is increased, we would obtain lower μ/ρ values, and therefore higher MFP and HVL values. On the other hand, if we increase the PbO concentration, higher μ/ρ values would be obtained and therefore lower MFP and HVL values.
Figure 2: Variation of MCNP and measured [15] μ/ρ values with PbO concentration at gamma energy range (0.356-1.332) MeV.
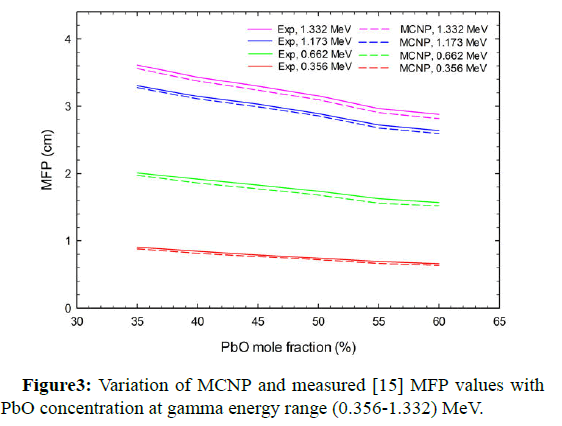
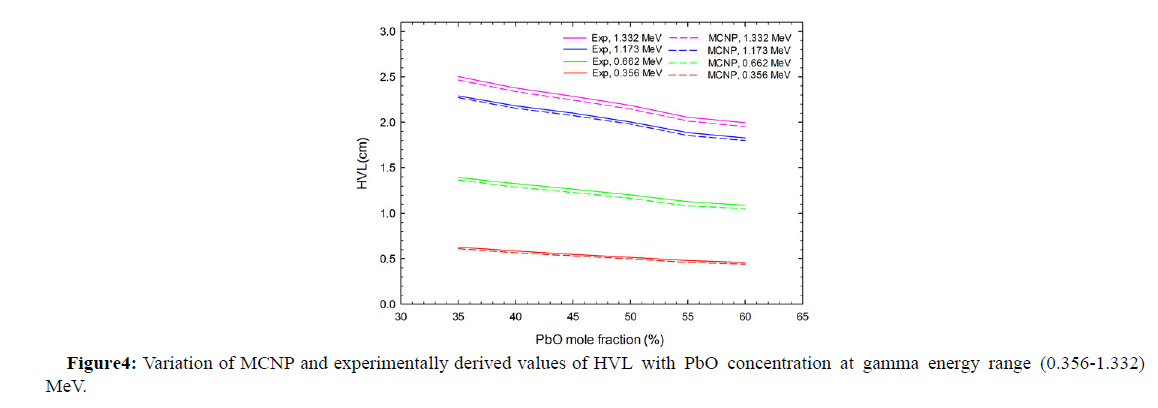
To investigate such conclusion, the simulated values of MFP and HVL were compared with those experimentally measured for the six glass simulants at gamma energy lines; 0.356, 0.662, 1.173 and 1.332 MeV. The results are presented in Table 4 and Table 5, respectively. In addition, the variation of both simulated and measured MFP and HVL values with PbO concentration at the four gamma energy lines; 0.356, 0.662, 1.1732 and 1.332 MeV was presented graphically in Fig. 3 and Fig. 4, respectively. As expected, (Table 4 and Table 5) and (Fig. 3 and Fig. 4) show that both MFP and HVL values increase with the increase in the photon energies and decrease with the increase of PbO concentration, for all six simulant glass samples.
Figure 3: Variation of MCNP and measured [15] MFP values with PbO concentration at gamma energy range (0.356-1.332) MeV.
| Energy (MeV) | Mean Free Path (cm) | |||||||||||
|---|---|---|---|---|---|---|---|---|---|---|---|---|
| Sample (1) | Sample (2) | Sample (3) | Sample (4) | Sample (5) | Sample (6) | |||||||
| MCNP | EXP | MCNP | EXP | MCNP | EXP | MCNP | EXP | MCNP | EXP | MCNP | EXP | |
| 0.356 | 0.6341 | 0.6607 | 0.6627 | 0.6926 | 0.7183 | 0.7418 | 0.7666 | 0.7898 | 0.8138 | 0.8452 | 0.8795 | 0.9052 |
| 0.662 | 1.5175 | 1.5701 | 1.562 | 1.6276 | 1.6812 | 1.737 | 1.7742 | 1.8283 | 1.8594 | 1.915 | 1.9739 | 2.0106 |
| 1.173 | 2.5954 | 2.6386 | 2.6726 | 2.7217 | 2.8426 | 2.8902 | 2.9668 | 3.0317 | 3.0734 | 3.1462 | 3.2277 | 3.3044 |
| 1.332 | 2.8167 | 2.878 | 2.9064 | 2.9647 | 3.0973 | 3.1538 | 3.2389 | 3.2982 | 3.3503 | 3.4307 | 3.5195 | 3.6109 |
Table4: The MCNP and available experimental data [15] of MFP for the six glass samples at gamma energy range (0.356-1.332) MeV.
| Energy (MeV) | Half-Value Layer (cm) | |||||||||||
|---|---|---|---|---|---|---|---|---|---|---|---|---|
| Sample (1) | Sample (2) | Sample (3) | Sample (4) | Sample (5) | Sample (6) | |||||||
| MCNP | EXP | MCNP | EXP | MCNP | EXP | MCNP | EXP | MCNP | EXP | MCNP | EXP | |
| 0.356 | 0.4395 | 0.458 | 0.4594 | 0.4799 | 0.4979 | 0.5141 | 0.5314 | 0.5473 | 0.5641 | 0.5857 | 0.6096 | 0.6273 |
| 0.662 | 1.0519 | 1.0881 | 1.0827 | 1.1279 | 1.1653 | 1.204 | 1.2298 | 1.267 | 1.2889 | 1.3271 | 1.3682 | 1.3933 |
| 1.173 | 1.799 | 1.8285 | 1.8555 | 1.8861 | 1.9801 | 2.0029 | 2.0735 | 2.101 | 2.1553 | 2.1803 | 2.2711 | 2.2899 |
| 1.332 | 1.9524 | 1.9945 | 2.0146 | 2.0545 | 2.1469 | 2.1856 | 2.245 | 2.2857 | 2.3391 | 2.3775 | 2.4663 | 2.5024 |
Table5: The MCNP and available experimentally derived values of HVL for the six glass samples at gamma energy range (0.356-1.332) MeV.
Conclusion
In this work, MCNP5 was employed to develop a gamma transmission model and explore its applicability in calculating the μ/ρ, MFP and HVL values for six simulant glass samples that were previously prepared and used for an experimental study by Kumar [15].
The MCNP simulations were carried at twenty gamma energy lines fall in the range (0.107-7.12) MeV, which provides a reasonable energy range at which gamma shielding features could be investigated.
On the basis of agreement between the μ/ρ values obtained by MCNP, XCOM and available experimental data, the geometrical model was employed to determine the MFP and HVL values at gamma energy range (0.276-7.12) MeV.
The available experimental values of MFP were used to derive the values of HVL as usable gamma shielding parameter affecting the glass shield design, which was missing in [15]. The Results of MCNP simulations for MFP and HVL parameters were compared with those experimentally generated at gamma energy range (0.356-1.332) MeV.
The effect of the PbO concentration on the simulated values of μ/ρ, MFP and HVL was also investigated and compared with available experimental results at gamma energy range (0.356-1.332) MeV. It is concluded that the MCNP results follow a trend similar to that reported experimentally in [15]; for all the six simulant glass samples, μ/ρ values decrease as photon energy increases and increase as PbO concentration increases. While MFP and HVL increase as photon energy increases and decrease as PbO concentration increases.
The glass sample with optimal gamma shielding capabilities; that is with highest values of μ/ρ, lowest values of MFP and HVL over all considered gamma energies, was found to be sample (1) of the chemical formula (Pb3B4O9). These results agree well with the conclusions reported by Kumar in [15] and validate the feasibility of employing the proposed geometrical model for additional calculations on the photon attenuation parameters of different glass compositions, a feature particularly useful in cases where no experimental data exist.
References
- Kaur S, Singh KJ (2014) Investigation of lead borate glasses doped with aluminium oxide as gamma ray shielding materials. Ann of Nucl Energy 63: 350–354.
- Kurudirek M (2017) Heavy metal borate glasses: Potential use for radiation shielding. J of Alloys and Compd 727: 1227-1236.
- Singh VP, Badiger NM (2015) Shielding Efficiency of Lead Borate and Nickel Borate Glasses for Gamma Rays and Neutrons. Glass Phys and Chem 41: 276-283.
- El-Khayatt AM, Ali AM, Singh VP (2014) Photon attenuation coefficients of Heavy-Metal Oxide glasses by MCNP code, XCOM program and experimental data: A comparison study. Nucl Instrum Methods Phys Res A 735: 207-212.
- 727
- Turgut U, Simsek O, Buyukkasap E, Ertugrul M (2004) X ray attenuation coefficients measurements for photon energies 4.508-13.375 keV in Cu, Cr and their compounds and the validity of mixture rule. Ann. Chim. Acta 515: 349-352.
- Medhat ME (2012) Application of gamma-ray transmission method for studies the properties of cultivated soil. Ann of Nucl Energy 40: 53-59.
- Akkurt I, Akyıldırım H, Mavi B, Kılıcarslan S, Basyigit C (2010) Gamma-ray shielding properties of concrete including barite at different energies. Prog. Nucl. Energy 52: 620-623.
- Lee CM, Lee YH, Lee KJ (2007) Cracking effect on gamma-ray shielding performance in concrete structure. Prog. Nucl. Energy 49: 303-312.
- Chanthima N, Kaewkhao J (2012) Investigation on radiation shielding parameters of bismuth borosilicate glass from 1 keV to 100 GeV. Ann. Nucl. Energy 12: 00429.
- El-Khayatt AM (2010) Radiation shielding of concrete containing different lime/ silica ratios. Ann. Nucl. Energy 37: 991-995.
- Kaundal RS, Sandeep K, Narveer S, Singh KJ (2010) Investigation of structural properties of lead strontium borate glasses for gamma-ray shielding applications. J. Phys. Chem. Solids 71: 1191-1195.
- Kaewkhao J, Limsuwan P (2010) Mass attenuation coefficients and effective atomic numbers in phosphate glass containing Bi2O3, PbO and BaO at 662 keV. Nucl. Instrum. Meth. Phys. Res. A 619: 295-297.
- Kirdsiri K, Kaewkhao J, Pokaipisit A, Chewpraditkul W, Limsuwan P (2009) Gamma-rays shielding properties of xPbO:(100-x)B2O3 glasses system at 662 keV. Ann. Nucl. Energ. 36: 1360-1365.
- Kumar A (2017) Gamma ray shielding properties of PbO-Li2O-B2O3 glasses. Rad Phys and Chem 136: 50-53.
- Elsheikh NAA, (2020) Gamma-ray and neutron shielding features for some fast neutron moderators of interest in 252Cf-based boron neutron capture therapy. Appl Rad and Isotope 156, 109012.
- Sharifi Sh, Bagheri R, Shirmardi SP (2013) Comparison of shielding properties for ordinary, barite, serpentine and steel-magnetite concretes using MCNP-4C code and available experimental results. Ann. Nucl. Energy 53: 529–534.
- Singh S, Kumar A, Singh D, Thind KS, Mudahar GS (2008) Barium–borate-flyash glasses: As radiation shielding materials. Nucl. Instrum. Meth. Phys. Res. B 266: 140-146.
- 136
- El-Khayatt AM, Akkurt I (2013) Photon interaction, energy absorption and neutron removal cross section of concrete including marble. Ann. Nucl. Energy 60: 8-14.
- Singh KJ, Singh N, Kaundal RS, Sing K (2008) Gamma-ray shielding and structural properties of PbO-SiO2 glasses. Nucl. Instr. Meth. Phys. Res. B 266: 944-948.
- Tarim U, Gurler O,Ozmutlu EN,Yalcin S (2013) Monte Carlo calculations for gamma-ray mass attenuation coefficients of some soil samples. Ann of Nucl Energy 58: 198–201.
- Berger MJ, Hubbell JH, Seltzer SM, Chang J, Coursey JS (2010). XCOM: photon cross sections database, NIST standard reference database (XGAM).
- Akman F, Turan V, Sayyed MI, Akdemire F, Kaçal MR et al (2019) Comprehensive study on evaluation of shielding parameters of selected soils by gamma and X-rays transmission in the range 13.94-88.04 keV using WinXCom and FFAST programs. Results in Physics 15: 102751.
- X-5 Monte Carlo Team (2003) MCNP-A General Monte Carlo N-Particle Transport Code: Overview and Theory. Los Alamos National Laboratory Version 5.
 Spanish
  Chinese
  Russian
  German
  French
  Japanese
  Portuguese
  Hindi
Hindi 