Research Article, Geoinfor Geostat An Overview Vol: 10 Issue: 8
Monitoring Recurrent Drought Vulnerability Using Geographic Information Systems in Algerian High Plateaus
Nabil Mega1*and Abderrahmane Medjerab2
1Department of Engineering, University of El Oued, El Oued, Algeria
2Department of Geography, University of Science and Technology Houari Boumediene, Bab Ezzouar, Algeria
*Corresponding Author: Nabil Mega
Department of Engineering, University of El Oued, El Oued, Algeria, Tel: +213551712288;
E-mail: mega-nabil@univ-eloued.dz
Received date: 05 July, 2022, Manuscript No. GIGS-22-68479; Editor assigned date: 08 July, 2022, PreQC No. GIGS-22-68479 (PQ); Reviewed date: 22 July, 2022, QC No. GIGS-22-68479; Revised date: 05 September, 2022, Manuscript No GIGS-22-68479 (R); Published date: 12 September, 2022, DOI: 10.4172/2327-4581.1000308
Citation: Mega N and Medjerab A (2022) Monitoring Recurrent Drought Vulnerability Using Geographic Information Systems in Algerian High Plateaus. Geoinfor Geostat: An Overview 10:8.
Abstract
The objective of this paper is to study the recurrent drought in the Algerian high plateaus between 1980 and 2012 through establishment of the recurrent drought vulnerability map. Based on five parameters: the Standardized Precipitation Index (SPI), the Precipitations (PP), the Enhanced Vegetation Index (EVI), the Land Cover (LC) and the Digital Elevation Model (DEM), the vulnerability map was developed by the introduction of the Analytic Hierarchical Process model (AHP, GIS based model), in the field of climatology, with three degrees of vulnerability: high, medium and low recurrent drought. The result show that the western and central regions of the study areas are the most exposed to recurrent droughts.
Keywords: Algerian high plateaus, Recurrent drought, Vulnerability, GIS, AHP
Introduction
In recent years in Algeria and particularly in the high plateaus, intense and recurrent droughts have caused the degradation of large areas of rangelands. The northwestern and central plains of Algeria were particularly affected by this phenomenon, resulting in significant decreases of yields and water resources with severe damages to crops [1]. The repetitiveness of long and intense droughts at the same time cause serious political, socio economic and environmental impacts. The government must think, in an objective way to find the adequate solutions (i.e, fight, strategies of adaptation, vulnerability, impact studies). Also, to mitigate the likely damage (exodus, degradation of the natural environment, limitation of sources of drinking water, etc.). Laborde established a precipitation map of northern Algeria, in collaboration with the National Agency for Hydraulic Resources (NAHR). This study shows the beginning of climate change which is pronounced in the North West region of Algeria, specifically in the Macta, Tafna and Cheliff basins, in the sense that the rainfall has decreased significantly over these regions. The studies carried out by Benlabiod, et al. Meddi and Hubert, Hirche, Talia, et al. and Hallouz, et al. also prove this. Benslimane, et al., show that the Algerian high plateaus region, for agro-pastoral vocation, the cause of soil degradation is mainly wind erosion [2-7]. This affects arid and semiarid rangelands under the action of natural phenomena (drought, reduction in the nourishing capacities of the plant cover, drying up of water points, etc.), Geographic Information Systems (GIS) comes to bring a plus in the study of drought through the multi criteria analysis model called Analytic Hierarchical Process model (AHP). Several studies around the world by using this method have proven its effectiveness in the study of drought [8,9]. With this in mind, this paper attempts to draw up a roadmap for the development of a recurrent drought vulnerability map which will expose the most vulnerable region to this phenomenon, and which will require optimal government intervention. AHP is a multi criteria method of decision support which considers several criteria to make the best decision. Ekrami, et al., using AHP method to assess drought in Taft town located in Yazd Province (Iran). The results showed that mountainous regions of the study area are more vulnerable to agriculture droughts compared with plains. Palchaudhuri and Biswas demonstrate that 70 % of the total area of Puruliya district (West Bengal, India) is under severe drought affecting about 14 blocks. In this study the criteria used to draw up the drought vulnerability map are long term drought that are characterized by the standardized precipitation index, calculated on a twelve month time scale (SPI-12), interannual Pluviometric averages (PP), Land Cover (LC), Digital Elevation Model (DEM) and the Enhanced Vegetation Index (EVI). This last index was selected for the study for its good vegetative response in the study region against Normalized Difference Vegetation Index (NDVI) which showed a weak response in an environment of low plant density). Huete and Jackson developed EVI, which corrects both the combined effect of soils and the atmosphere in arid and semi-arid regions [10].
Materials and Methods
Study area
Administratively, the territorial high plateau unit of Algeria comprises 14 provinces (total 48 Algerian provinces) spread across three areas: the West, Central, and East high plateaus [11,12]. East high plateaus consists of Sétif, Bordj Bou Arreridj, Batna, Khenchela, Tébessa, and Oum El Bouaghi provinces. Center high plateaus consists of Djelfa, Laghouat, M'sila, and Tissemsilt provinces. West high plateaus consists of Tiaret, Saida, Naama, and El Bayadh provinces. The geographic location of the study area is illustrated in Figure 1 it has a total area of 227,412 km2. Figure 1 shows also the distribution of the selected climate stations in the study area.
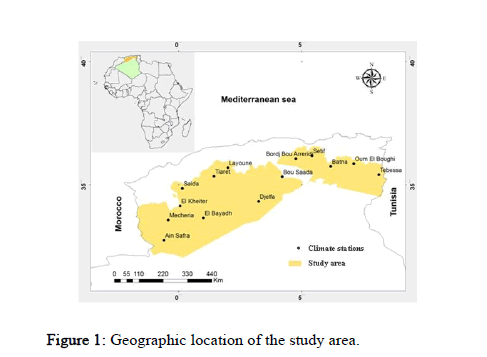
Figure 1: Geographic location of the study area.
Climate framework
Algeria and especially in the West experienced several major droughts during last century from the 1940’s and 1980’s to the present day. The most recent was characterized by the decrease in rainfall (rainfall does not exceed 400 mm annually) associated with the considerable increase in temperature during the last two decades, influenced by its spatial extent, its intensity and by its major impact on the reduction of water resources [13]. Figure 2 shows an example of three stations that are spread over the study area, stations: Mecheria (Westside), Bou Saada (at the center) and Batna (East side). Several droughts with three time scales: 3 months (SPI-3), 12 months (SPI-12) and 24 months (SPI-24) which affected the study area? Extreme drought was recorded in Mecheria region, in the period 1982-1986 (SPI-24Ë?-2.5). In 1997, this station marked a second moderate drought, less intense but longer than the first period (SPI-24Ë?-1.5) which begins from 1997 to 2004. For Bou Saada region, we see significant periods of drought. The first is severe (with SPI-24Ë?-1.5) which begins in 1982 and lasts until 1984. The second drought explains a very significant SPI-24 (Ë?-2.5) which means that an extreme drought occurred between 1986 and 1990. Concerning Batna station, we recorded two periods which characterize a severe drought (SPI-24Ë?-1.5, in 1984 to 1985, and 1987 to 1990), and two periods indicating an extreme drought (SPI-24Ë?-2, in 1993 to 1996, and 1998 to 2003, the latter persisted for six years). The three stations of Mecheria, Bou Saada, and Batna reflect the state of drought that frequently affects the high plateaus region of Algeria.
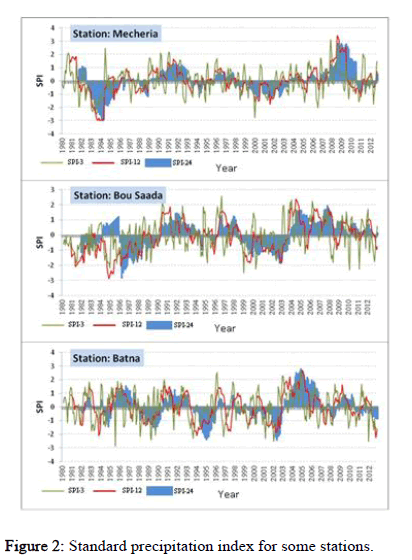
Figure 2: Standard precipitation index for some stations.
Methodology
Multi criteria analysis is an analysis technique that aims to assess a coherent family of criteria and to inform a decision process. The multi criteria character takes into account several objectives, varied and possibly contradictory. It, therefore, makes it possible to group problems including several dimensions. Among these models is the Analytic Hierarchical Process (AHP) model. The AHP model, developed in 1971 by Thomas L. Saaty, it is distinguished by its way of determining the weights and the quality of the criteria, it proceeds by binary combinations of each level of the hierarchy compared to the elements of the higher level [14]. The AHP model consists in representing a decision problem by a hierarchical structure, reflecting the interactions between the various elements of the problem, then making pair wise comparisons of the elements of the hierarchy and finally determining action priorities. This method has been used in such varied fields: transport planning, town planning management, price fixing, buying a vehicle, choosing production systems in industries and many others (Table 1).
Table 1: Saaty's scale.
Reciprocity means that if element A is assigned by one of the Figures in Table 1 when compared to element B, B will, therefore, have the opposite value when compared to A at each node broken down into n elements, it is necessary to carry out (n (n-1))/2 comparisons per pair. Table 2 shows the hierarchical organization adopted of the criteria and sub-criteria, as well as the ranks and the justifications of each sub criterion.
Table 2: Hierarchy and ranks of decision criteria and sub-criteria.
*T+Bs: Trough+Bare soil.
**C+M+M+F: Culture+Meadows+Mosaïque (natural vegetation (Ë?50%)+cultivated land (Ë?50%))+Forest et reforestation.
***A+S+S+R+U: Alfa+Sparta+Sagebrush+Remth+Urban.
Now we determine the relative importance of the elements by calculating the eigenvectors corresponding to the maximum eigen values of the comparison matrices. The criteria are compared on a scale from 1 to 9 as recommended by Saaty and Vargas where 1 implies that there is no preference between the two criteria and 9 means that one factor is extremely favored over another [15]. This produces a square matrix in which the rows and columns are the criteria. Table 3 presents the standardized matrix of criteria, as well as the overall evaluation score (C) attached to each of the identified alternative solutions.
Table 3: Standardized matrix of criteria and evaluation score.
The priority vectors (C) define the advantage of each alternative compared to the other. We recall that the vectors D and E are used for the computation of the coherence of the matrices in the next phase (Table 3). Checking the consistency of the judgments. We calculate, first of all, the coherence index IC given by equation 1:
IC= (λmax-n)/ (n-1) (1)
Where λmax is the maximum eigenvalue corresponding to the pairwise comparison matrix and n is the number of elements compared. We calculate the Coherence Ratio (CR) defined by the equation 2:
CR= 100 IC/ACI (2)
Where ACI is the average consistency index and obtained by randomly generating judgment matrices of the same size. The values of the ACI are set out in Table 4.
Table 4: Average consistency index.
A CR value, less than 0.10 (Ë?10% of errors) 16, is generally acceptable, if not, pair-wise comparisons should be revised to reduce inconsistencies. Table 5 presents the values which explain a good coherence for the matrices of the criteria and the matrices of subcriteria (the matrices of the sub criteria are not shown in this paper).
Table 5: Checking the consistency of the matrices.
After having obtained the weights of each criterion and subcriterion, we move on to the execution of the different weights on the classified maps. The execution was carried out with ArcGIS software. To achieve an optimal spatial result, the following rules were observed: organize all the maps under the same spatial resolution, rasterize vector maps, and the different maps have the same geographic extent.
Results and Discussion
This study presents a promising initiative for the establishment of a recurrent drought vulnerability map, which will expose the regions that are most vulnerable to this phenomenon, and which will require optimal government intervention. The study of vulnerability is accomplished by a multi-criteria analysis method (AHP). It is a multi criteria and decision making method which considers several criteria to make the best decision. The criteria used to draw up the drought vulnerability map are long term drought they are characterized by the standardized precipitation index, calculated on a twelve month time scale (SPI-12), interannual average Precipitations (PP), Land Cover (LC), Enhanced Vegetation Index (EVI, selected for the study for its good vegetative response in the study area against NDVI which showed a weak answer), and the Digital Elevation Model (DEM).
Figure 3 shows the SPI calculated over a twelve month time scale (SPI-12) and classified into four intensity degrees: extreme, severe, average and wet. The interannual average Precipitations (PP), presented in Figure 4, is classified into four frequency degrees: very low, low, average and high. The spatial interpolation method used for the two parameters SPI-12 and PP are Inverse Distance Weighting (IDW) because it is the optimal method in the case where the points are far apart.
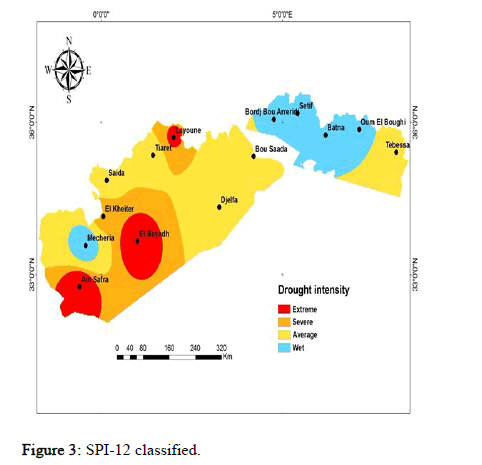
Figure 3: SPI-12 classified.
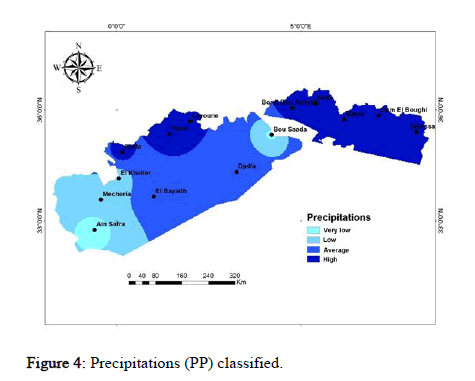
Figure 4: Precipitations (PP) classified.
The Land Cover (LC) Figure 5 presents a satellite product developed by the European Space Agency (ESA) for the year 2015. The products (images) of the land cover are available to download, free of charge, from the ESA server (available from 1992 to 2015, with a geometric resolution of 300 meters. These images are the fruit of 24 years of classifications and processing data from several satellite platforms (MERIS, 1 Km SPOT-VEGETATION, 1 Km PROBA-V, 1 Km AVHRR). Once the image ordered, downloaded and the study area was extracted, the classes of this image were converted to approve the landscape of our study area (the high plateaus). LC is classified into three density degrees: very sensitive, average sensitivity and low sensitivity. Figure 6 shows the Digital Elevation Model (DEM) which is a product of the American Shuttle Radar Topography Mission (SRTM). A mission led by the National Aeronautics and Space Administration (NASA) with an altimetric resolution of 30 meters. DEM is classified into three altitude classes: low, average and high (Figure 6).
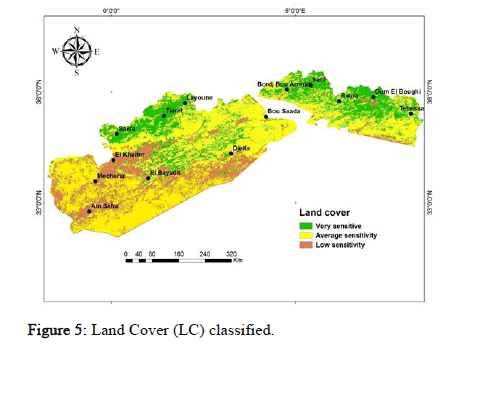
Figure 5: Land Cover (LC) classified.
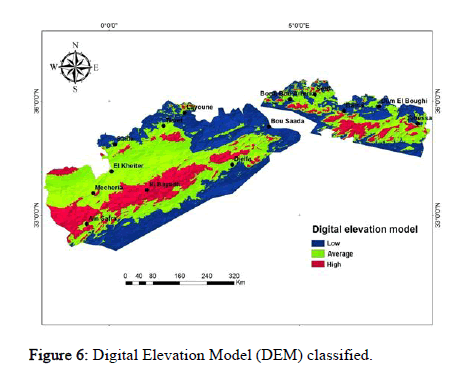
Figure 6: Digital Elevation Model (DEM) classified.
Figure 7 shows the vegetation cover obtained from the Enhanced Vegetation Index (EVI). A satellite product of the MODIS (Moderate Resolution Imaging Spectroradiometer) instrument onboard the American satellite Terra. With a spatial resolution of 5 km, this product was selected for its good vegetative resolution in conditions where the vegetation cover is sparse. The EVI is classified into three density classes: low, average and dense.
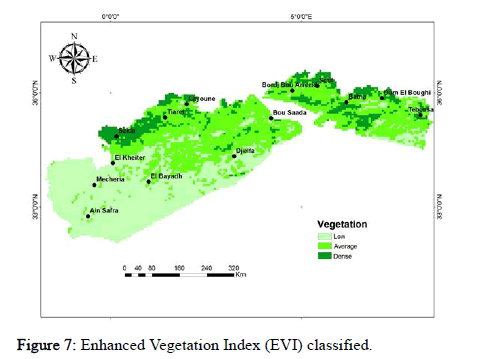
Figure 7: Enhanced Vegetation Index (EVI) classified.
The recurrent drought vulnerability map is illustrated in Figure 8. We note that the Western and Central regions of the study area (grouping the provinces: Naâma, El Bayadh, Saida, Tiaret, Tissemsilt, Djelfa, Laghouat, and Ms'ila) are most vulnerable to repetitive drought. Indeed, the area affected by a high vulnerability is estimated at 75,543 km2 or 46% of the total area of the study area, and an area of 59,469 km2 (36% of the area of the western and central high plateaus) concerns the same regions this time affected by an average risk of drought. Therefore, a total of 82%, of the area of the western and central high plateaus presents a vulnerable situation vis-à-vis recurrent drought. The Eastern region (which includes the provinces of Sétif, Bordj Bou Arreridj, Batna, Oum El Bouaghi, Khenchela, and Tébessa) shows moderate drought vulnerability (an area of 49,973 km2 or 66% of the total area of the region presents a low risk for drought and just a rate of 5% for high risk).
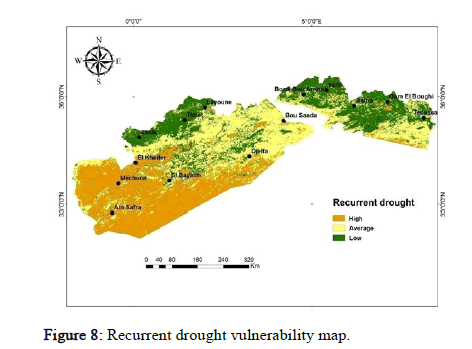
Figure 8: Recurrent drought vulnerability map.
The present recurrent drought study was carried out using a multi criteria analysis method (AHP), under a GIS environment that provides useful information on drought monitoring in the high plateaus of Algeria. This is a robust method using five important parameters to define the recurrent drought scenario in the study area. The weights obtained using the AHP depend mainly on the weight defined by the expert. On the other side, there are limitations in the use of the AHP method due to the lack of other reliable data (such as soil moisture, wind and demographic data). Also the low density of the climate stations implies an average spatial interpolation of certain parameters such as precipitation and drought index. This did not further hamper the quality of the result.
Conclusion
The purpose of this study is to draw up a recurrent drought vulnerability map which affects regions threatened by different intensities of drought. We have opted for the classification of three drought levels: high, medium and low. Five parameters have been integrated into this mapping including the standardized precipitation index, calculated on a twelve month scale (SPI-12), the interannual average Precipitations (PP), the Enhanced Vegetation Index (EVI), the Land Cover (LC) and the elevation (DEM). The resulting map showed us that the western and central regions of the high plateaus are the most exposed to recurrent drought. Although it presents a less alarming situation, the Eastern region remains vulnerable. The quality of the recurrent drought vulnerability map obtained depends on several criteria, which must be taken into consideration: a) The number and quality of the selected criteria, b) Determining which alternative is the most compatible with our criteria and the level of importance that we give to them, c) The correct selection of the sub criteria, d) The choice of the optimal weights of the criteria and sub criteria, e) The right binary combination between the criteria and the sub-criteria and finally, f) Ensuring the consistency of the matrices. This type of map (recurrent drought vulnerability) will allow the concerned authorities to seriously consider and take the necessary measures to mitigate the disastrous effects resulting from recurrent droughts such as desertification and rural exodus.
References
- Hind M, Mohamed M, Ali A (2013) Study of drought in seven Algerian plains. Arabian J Sci Eng 39:339–359.
- Benlabiod D, Medjerab A, Mega N (2020) Characterization of drought events in south Oran and south Algiers steppes in Algeria. Int J Ecol Dev 35:1-14.
- Meddi M, Hubert P (2003) Impact of the modification of the rainfall regime on the water resources of North-West Algeria Hydrology in Mediterranean and semiarid regions: international conference, Montpellier, France, 1-4 April 2003 2003. 229-235.
- Hirche A, Boughani A, Salamani M (2007) Évolution de la pluviosité annuelle dans quelques stations arides algériennes. Sci Planet Change 18: 314-320.
- Talia A, Meddi M, Bekkoussa BS (2011) Study of the variability of rainfall in the high plateaus and the Algerian Sahara. Sci Planet Change 22:149-158.
- Hallouz F, Meddi M, Mahe G (2013) Modification du régime hydroclimatique dans le bassin de l’Oued Mina (nord-ouest d’Algérie). J Water Sci 26:33-38.
- Palchaudhuri M, Biswas S (2016) Application of AHP with GIS in drought risk assessment for Puruliya district, India. Nat Hazards 84:1905-1920.
- Ekrami M, Marj A, Barkhordari J, Dashtakian K (2016) Drought vulnerability mapping using AHP method in arid and semiarid areas: a case study for Taft Township, Yazd Province, Iran. Environ Earth Sci 75:1039.
- Huete AR, Jackson RD (1987) Suitability of spectral indices for evaluating vegetation characteristics on arid environments. Remote Sens Environ 23:213-232.
- Mega N, Medjerab A (2021) Statistical comparison between the Standardized Precipitation Index and the Standardized Precipitation Drought Index. Model Earth Syst Environ 7:373–388.
- Mega N, Medjerab A (2016) Study of climatic drought in Algerian high plateaus using standardized precipitation index and observations from moderate resolution imaging spectroradiometer. J Appl Remote Sens 10:046002.
- Hamlaoui-Moulai L, Mesbah M, Souag-Gamane D, Medjerab A (2013) Detecting hydro-climatic change using spatiotemporal analysis of rainfall time series in Western Algeria. Nat Hazards 65:1293-1311.
- Saaty TL (2001) Fundamentals of the Analytic Hierarchy Process. The Analytic Hierarchy Process in Natural Resource and Environmental Decision Making. Managing Forest Ecosystems. Kluwer Academic Publishers. Dordrecht, Swizerland. 3.
- Saaty TL, Vargas LG (1991) Prediction, projection, and forecasting: applications of the analytic hierarchy process in economics, finance, politics, games, and sports. Kluwer Academic Publishers, Boston, New York, 254.
- Bannari A, Huete AR, Morin D, Zagolski F (1996) Effets de la couleur et de la brillance du sol sur les indices de végétation. Int J Remote Sens 17:1885-1906.
 Spanish
  Chinese
  Russian
  German
  French
  Japanese
  Portuguese
  Hindi
Hindi 
