Research Article, J Hydrogeol Hydrol Eng Vol: 12 Issue: 1
Knowledge of the geometry and structure of the Turonian aquifer for water exploitation in the Eastern Part of Boudnib Basin (Errachidia-Morocco)
Fadwa Laaraj1*, Mohamed Chibout2and Mohammed Benabdelhadi1
1Department of Sciences and Technology, Sidi Mohamed Ben Abdellah University, Fes, Morocco
2Department of Science, Sidi Mohamed Ben Abdellah University, Fes, Morocco
*Corresponding Author: Fadwa Laaraj
Department of Sciences and Technology, Sidi Mohamed Ben Abdellah University, Fes, Morocco
E-mail: fadwa.laaraj@gmail.com
Received date: 06 October, 2022, Manuscript No. JHHE-22-76588;
Editor assigned date: 10 October, 2022, PreQC No. JHHE-22-76588 (PQ);
Reviewed date: 24 October, 2022, QC No. JHHE-22-76588;
Revised date: 06 February, 2023, Manuscript No. JHHE-22-76588 (R);
Published date: 13 February, 2023, DOI: 10.4172/2325-9647.1000247
Citation: Laaraj F, Chibout M, Benabdelhadi M (2023) Knowledge of the Geometry and Structure of the Turonian Aquifer for Water Exploitation in the Eastern Part of Boudnib Basin (Errachidia-Morocco). J Hydrogeol Hydrol Eng 12:1.
Abstract
The region of Boudnib is located in southeast Morocco and depends on the territorial region of Draa-Tafilalet and the province of Errachidia. It has a water deficit due to the lack of rainfall in the region and the overexploitation of groundwater. 76 electrical drillings were drilled and correlated with borehole and seismic reflection data to understand and identify the structure and geometry of the deep aquifer to facilitate the selection of future boreholes and wells. The geophysical study allowed us to differentiate three families of electrical boreholes. These families are separated by two geoelectrical discontinuities D1 and D2. That of D1 coincides with the core of a ramp fold anticline, which affects the Tertiary and whose detachment plane is located above the Turonian roof. The conductive level B of the longitudinal conductor map C presents a good aquifer for the future exploitation of water it is rich in sands and the longitudinal conductance A1 which is located at the level of the family A represents a zone less favorable to the exploitation of water because it has important contents of clayey element.
Keywords: Water resources; Electrical survey; Seismic; Boudnib basin; Geometry
Introduction
The Boudenib basin, covering an area of 15189 Km2, is located in the southeast of Morocco. It occupies a position of depression between two major structural areas: The Anti-Atlas in the south and the high Atlas in the north and it are characterized by several aquifer systems with different water potentials. The water resources in the region of Boudenib are in the process of destocking, especially those of the superficial aquifers. To reduce the effect of overexploitation of shallow aquifers, the use of water from deep aquifers remains a timely solution to fill the water deficit present in the region.
The reconstruction of the geometric configuration of the aquifer system in the Boudenib area can be improved, by integrating the data from the electrical drilling, by the identification of the resistivity and thickness of each underground geological unit [1].
The region has been the subject of numerous geological and hydrogeological studies since 1930 [2-5]. Several geophysical campaigns were realized in the Errachidia-Boudnib basin in the framework of groundwater research, electrical prospecting began in the 1950’s with small, scattered campaigns where it was possible to highlight the structural features of the basin. The objective was to facilitate the location of exploratory drilling [6].
This work is to specify the geometric and structural architecture of the aquifers of the eastern part of the Boudenib basin, for reasonable management of these aquifers. To achieve this goal, we used data from electrical drilling in the study area correlated with hydraulic drilling data and seismic data.
These data were provided by the agency of the hydraulic basin of Guir-Ziz-Rheris, as for the interpretation of the electric drillings they were carried out within the company Africa geo-services [7].
Materials and Methods
General framework
The Boudenib basin is located South of the High Atlas. It is limited to the east by the Bouanane basin, to the south by the Hamada of Guir and to the west by the paleozoic outcrops of the Anti-Atlas (Figure 1).
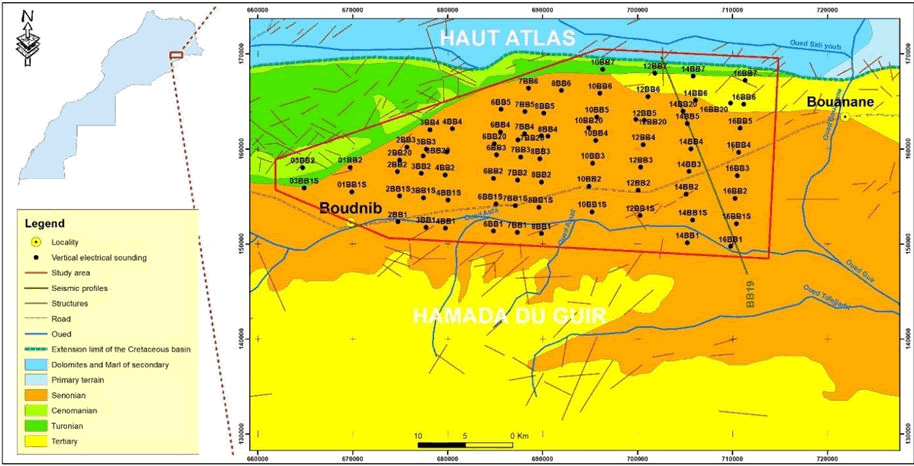
Figure 1: Geographic and geological location map of the Errachidia-Boudnib cretaceous basin (Extract from the geological map of the high atlas of Anoual-Bouanane 1/200000, 1976).
The geological map of the study area was developed from the Rich and Boudnib geological map 1/200000 and the geological map of the high Atlas of Anoual-Bouanane 1/200000. The cretaceous formations outcrop in the Boudnib Basin from the West and beyond Bouanane in the East. In the North, they are generally in abnormal contact with the limestone’s of the central and eastern high Atlas. In the South, they are located on the primary terrain of the Anti-Atlas. Sedimentation is carried out in the epicontinental regime and has significant variations in thickness and facies. The infra cenomanian corresponds to continental cryptogenic formations, the result of the destruction of precretaceous reliefs.
The infra cenomanian: Outcropping to the South of the study area consists of alternating sandstone and marly clays. It has a variable thickness that exceeds 500 m in most regions.
The cenomanian: Consists of limestone and dolomitic limestone, interspersed with marl. These marls become more frequent towards the base of the formation. Towards the center of the study area, the marl content seems to be increasing. The upper part of the limestone formation, found in the plateaus, is massive and forms spectacular escarpments.
The cenomano turonian: Forms thick dolomitic limestone cliffs resting on a series of clays and sandstones. It was deposited during a period of a very important transgression of the sea, which then played a significant role in the colonization of the water tables by the marine crustaceans during the terminal regression.
The senonian: Consists of very heterogeneous clay sandstone continental formations, but also gypsum and anhydrite, which thickness varies from 70 m in the East to 500 m in the North.
The quaternary: Quaternary lands are highly developed and occupy synclinal basins as well as plains, especially in the East. Depending on the place, more or less cemented puddings, gravelly alluvium, lacustrine limestone, silt and alluvium represent these terrains. The cretaceous basin of Boudenib forms, between the high Atlas and the Anti-Atlas, a vast asymmetrical syncline whose axis, oriented substantially WSW-ENE, is parallel to the structural orientation of the high Atlas.
Groundwater in the cretaceous basin plays a key role in meeting the water needs of the province of Errachidia. These resources consist of, on the one hand, aquifers located along the valleys and characterized by their small extent and their direct dependence on climatic hazards and on the other hand, deep layers that are subdivided from bottom to top into three aquifers: The infracenomanian, the Turonian and the Senonian [8].
Phreatic table (Quaternary
Located along valleys and characterized by their direct dependence on climatic hazards. Except for the Tafilalet plain, which is relatively large in area, other quaternary aquifers are characterized by small areas.
The persistence of cumulative rainfall deficits over the last five years, combined with the intensive use of the most accessible water resources, has resulted in a widespread decline in the piezometric level of most of the region's water tables. This drop varies between 4 m and 5 m and can reach 8 m to 10 m in the water tables of Errachidia and Tinjdad [9].
Deep phreatic tables
The basin of Errachidia, which extends between the high and the Anti-Atlas, includes aquifers that are from top to bottom.
• Senonian water, exploited by wells and sinking.
• Water tables of the Turonian limestones, which create the sources of Tifounassine, Meski and Tarda.
• The aqueduct of the locally artesian infracenomanian is drained by a Khettara complex south of the Goulmima Tinjdad area. This water table is little exploited due to its salinity in the downstream area and its depth.
Approach used
To meet the objectives of this study, we have exploited the data from all the drilling, electrical soundings and seismic data that have been carried out and which have not been the subject of any hydrogeological synthesis to date.
In our study, we have taken up the surveys carried out by the directorate of water research and planning and the bureau of petroleum and mining research.
76 electrical soundings spread over an area of 810 m2 were carried out. These schlumberger-type soundings are made with an AB line length between the emission electrodes of 10000 m [10].
Results and Discussion
Result achieved
The correlation between the electrical sounding data allowed us to differentiate three families of soundings (A, B and C), each characterized by a different electrical response (Figure 2).
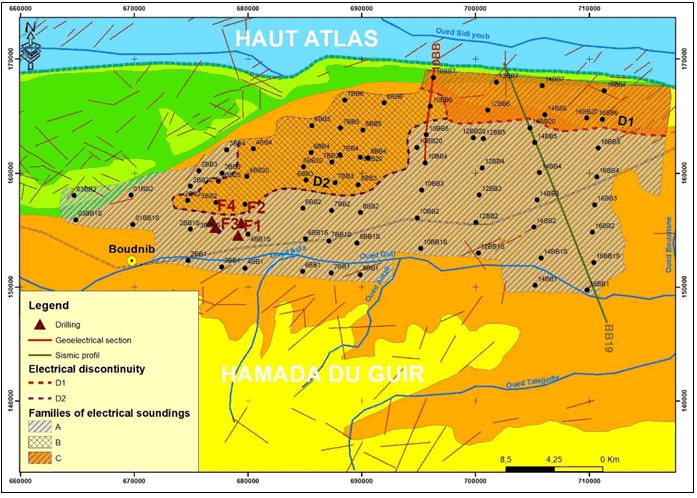
Figure 2: Distribution of the families of electrical soundings.
Family A
This family is characterized by the electrical sounding 3BB1S, the examination of its diagram shows the presence of an assembly represented by resistant and conductive layers (Ro, C), of a thickness of approximately 115 m.
According to the data from drillings, this ensemble corresponds to conglomerates and alternating sands and clays and could constitute a good aquifer (Figures 3 and 4).
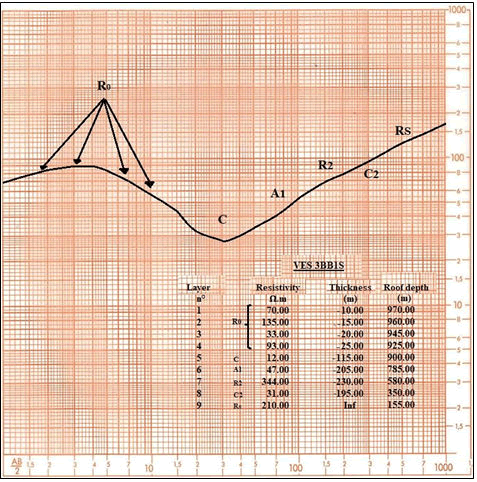
Figure 3: Diagram of the electrical sounding 3BB 1S.
The ensemble (Ro, C) overlies an intermediate level A1 with a resistivity of 47 Ω.m and a thickness of 205 m, under this cover (Ro, C, A1), we observe the presence of a resistant set (R2+ Rs) responsible for the rise of the curve (Figure 3). This level is interspersed with a conductive C2 level (31 Ω.m-195 m), whose presence is difficult to identify on the diagram, this level can be present in the R2+Rs set by the effect of enrichment in conductive past (marl) which constitutes an anisotropic layer.
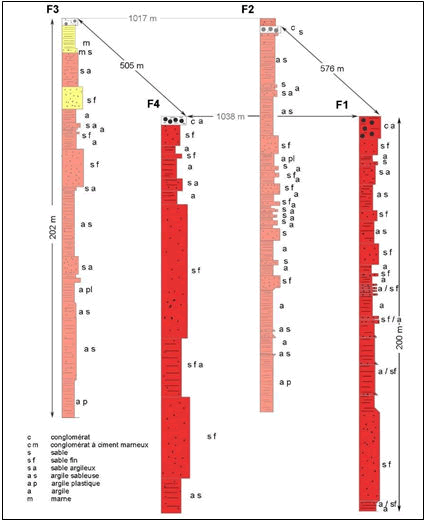
Figure 4: Simplified lithological section of drillings F1, F2, F3 and F4.
According to the results of seismic reflection and drilling, the resistant level R2 (344 Ω.m–230 m) corresponds to the sandstone and clay-limestone series of the Maastrichtian-Eocene. The conductive level C2 would correspond to the marly and gypsiferous series of the Santonian Campanian. The top of the resistant bedrock Rs would be the top of the Coniacian-Santonian and Turonian dolomitic limestone’s.
Family B
The curves of the electrical soundings 6BB3 and 7BB6 are plotted to highlight the plunge of the roof of the R2+Rs resistance set from SEV 6BB3 to SEV 7BB6 and the important development of the C1 cover with a thickness that increases from 220 m (SEV 6BB3) to 330 m (SEV 7BB6). The diagram of the SEV 6BB3 shows in its lower part an electrical section similar to the one in the previous diagram (SEV 3BB1S). The conductive level C2 inserted in the resistive assembly R2+Rs with comparable physical characteristics, in this case, there is a change in the geoelectric behavior of the set (C, A1) of the SEV 3BB1S diagram which does not differ electrically from the set (D1, C1) (Figure 5).
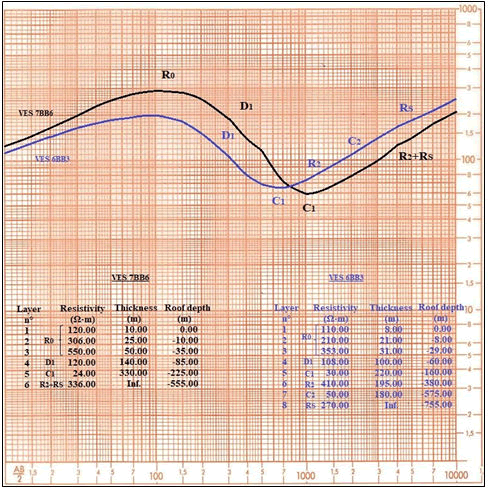
Figure 5: Diagram of electrical soundings 7BB6 and 6BB3.
We notice an increase in the resistivity of the conductive level C1 from the South to the North of the electrical discontinuity D2. The roofs of the resistant levels R2 and Rs reach depths of 380 m and 755 m respectively.
Dans le diagramme du SEV 7BB6, aucune inflexion significative was observed on the rise of the curve due to the low value of the longitudinal conductance of the conductor C2 par rapport au conducteur C1. Then, we cannot estimate the depth of the resistor roof Rs.
Family C
This family of electrical soundings located to the NNE of the study area shows the presence of a 400 m thick heterogeneous assemblage overlying a resistant R2' level (227 Ω.m-420 m) (Figure 6).
Below this level is a thick conductive level Cp (15 Ω.m-1320 m) that overlies an infinitely resistant bedrock Rp whose roof reaches a depth of 2140 m.
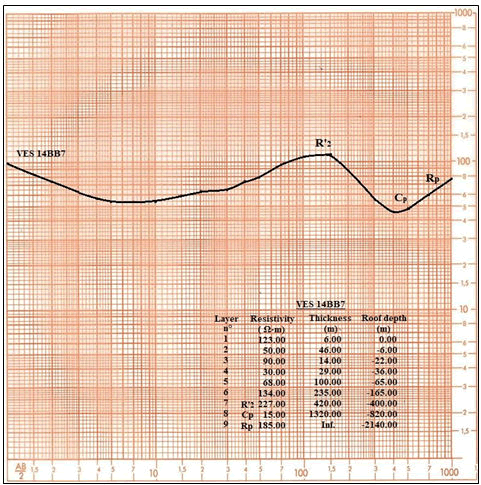
Figure 6: Diagram of electrical sounding 14 BB7.
The origin of the differences in the geoelectric properties of family C compared to those of A and B is the same. As one approaches the high Atlas (probably syn-orogenic cluse), the coarse detrital deposits are earlier, thus located below the discontinuity, whereas further south, the H1 horizon approaches the base of the syn-orogenic detrital formations and thus the roof of the R2. A second factor intervenes and explains the origin of this difference: The ramp folds visible in the North- East and affecting essentially the Tertiary conglomerates which outcrop in places (Figures 7 and 8). The H1 horizon passes over the structure while the resistant bedrock roof R2 is located in a subhorizontal fracture zone. This has induced thickening of the Cp conductive level (separating some Tertiary deposits) and a deepening of the resistant R2 roof to the south of this zone. Thus, the geoelectric discontinuity D1 is of tectonic origin. As for the horizon H2, it corresponds to the roof of the Turonian formations.
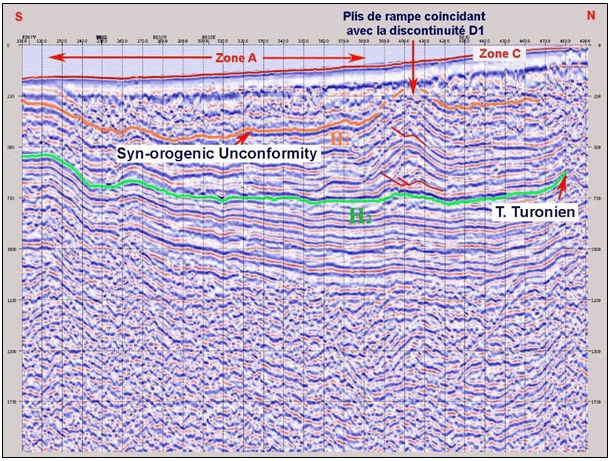
Figure 7: Extract from seismic section BB19.

Figure 8: Geoelectric section10 BB.
The geoelectric section 10 BB is chosen for a better comparison between geoelectric and seismic results, it crosses the three families of electrical sounding and the roofs of the orange Oligocene, yellow Santonian and green Turonian horizons of the seismic profile. Towards the northern end of section 10 BB, we have the presence of the electrical sounding discontinuity D1 that separates family C from both families A and B. North of this electrical discontinuity D1, the resistant bedrock Rs (Santonian and Turonian limestone) are probably eroded. The electrical discontinuity D2 affects the overlap of the resistive assembly R2+Rs and separates the two electrical sounding families A and B.
Analysis of the isohypses maps
Following the quantitative interpretation of the electrical soundings, three isohypses maps are drawn, giving the appearance of the roofs of the resistant levels R2+Rs, R2' and Rs. These maps are represented at a scale of 1/100.000 and with an equidistance of 20 m except for the isohypses map of the roof of the resistant level R2', where the equidistance is 50 m. On the isohypse maps of the roof of resistors R2+Rs and Rs the two electrical discontinuities D1 and D2 are plotted. The two electrical discontinuities D1 and D2 are plotted on the isohypses of the R2+Rs and Rs resistors. On the isohypses of the roof of the resistant level R2', only the electrical discontinuity D1 has been traced, this is due to its absence in the other parts.
Analysis of the roof isohypses map of the resistant ensemble R2+Rs
Isohypses values vary considerably from 883 m (SEV 02BB2) for the highest point to 415 m (SEV 14BB20) for the lowest point. This map shows an area with a strong isohypses gradient located to the west and northwest and an area with a weak isohypses gradient to the east and south, It is divided into four zones, a high zone H characterized by a strong gradient of isohypses explaining the presence of an accentuated rise towards the northwest and west of the roof of the resistant R2+Rs. The highest point is located at SEV 2BB2 (883 m). This zone is limited by the electrical discontinuity D2, which would correspond to a flexure a low zone S2 characterized by a strong gradient of isohypses, which explains a noticeable dip of the roof of the resistant, R2+Rs towards the north. The lowest point reaches a height of 305 m at SEV 8BB6; A low zone of reduced extension S3 with a low gradient of isohypses is located in the vicinity of the city of Boudenib. The lowest point reaches a height of 540 m at the SEV 1BB1S; a low zone of vast extent S1 with a low gradient of isohypses which occupies the eastern part of the study area, its axis is substantially oriented SW-NE. The roof of the resistant R2+Rs set dips to the NE to reach its lowest value of 415 m at SEV 14BB20 (Figure 9).
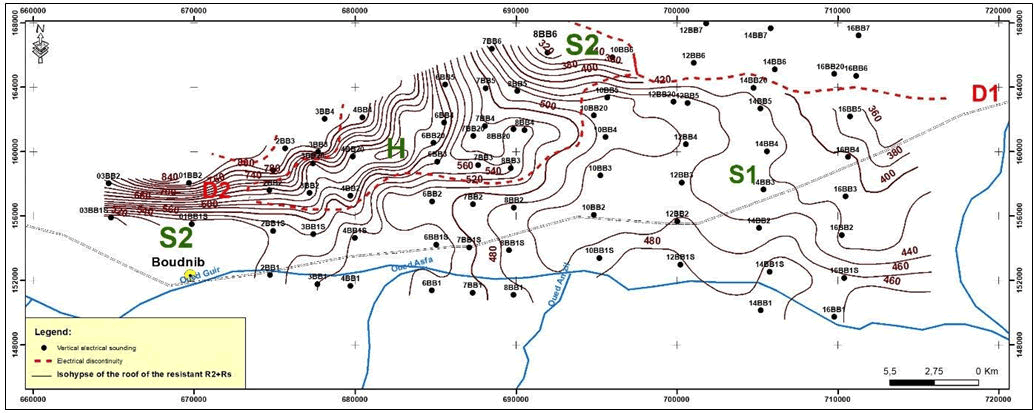
Figure 9: Roof isohypses map of the resistant ensemble R2+Rs.
North of the electrical discontinuity D1, another resistive level R2' (family C) is highlighted and presents physical characteristics that are different from those of the resistive level R2 (Figure 10).
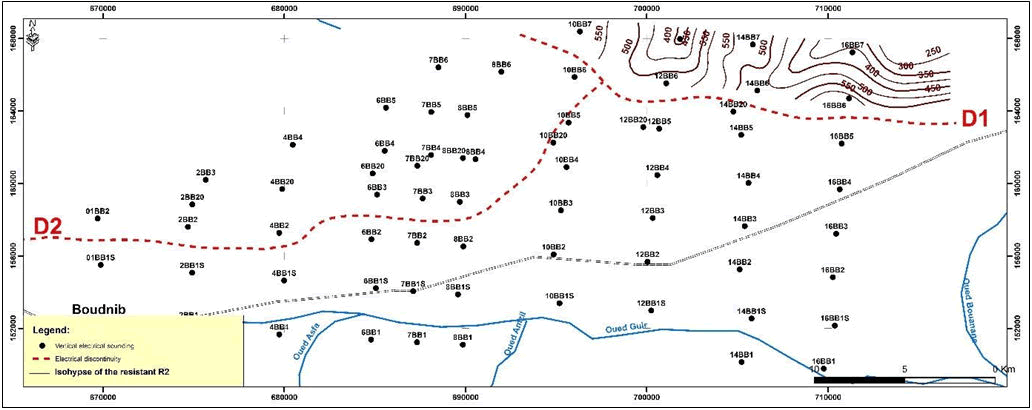
Figure 10: Map of the isohypses of the roof of the resistant R2'.
This map (Figure 10) was plotted only north of the electrical discontinuity D1. The isohypses vary considerably and range from 587 m (SEV 16BB6) for the highest point, to 410 m (SEV 16BB7) for the lowest point. The analysis of this map highlights the presence of two depressions of a reasonably small extension at the level of soundings 12BB7 and 14BB7. These are separated by a high zone that reaches 550 m. The roof of the resistant R2' rises towards the west at the level of SEV 10BB7 (583 m) (Figure 11).
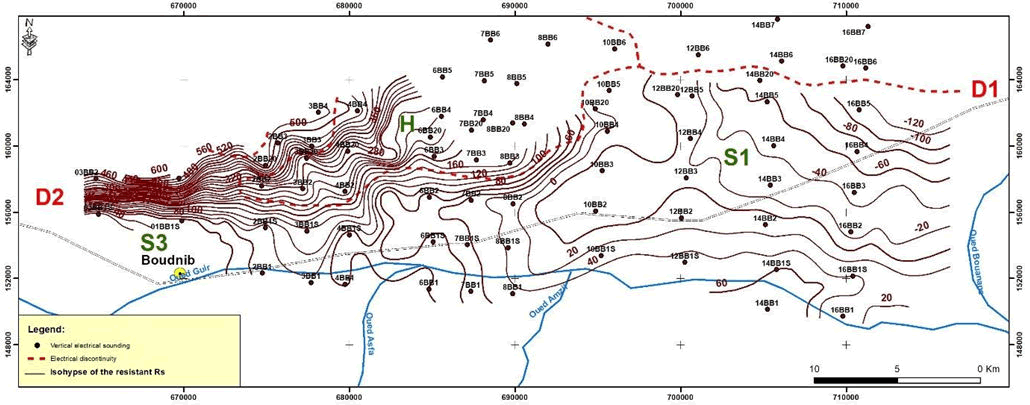
Figure 11: Isohypses map of the resistant bedrock roof Rs.
The determination of the depth of the roof of the resistant Rs, especially towards the North at the edge of the electrical discontinuity D1, is conditioned by the thickness of the underlying conductor C2. Its thickness remains uncertain because the conductive level C2 is sometimes, difficult to identify on the electrical sounding curves. The nature of the C2 conductor (homogeneous isotropic layer or anisotropic layer) determines its physical characteristics.
The resistant bedrock map Rs shows in its broad outlines a structural pattern similar to that of the resistant R2+Rs roof isohypses map. There is also the high zone H, where the highest point reaches a height of 618 m at SEV 02BB2 and the two low zones S1 and S3, where the lowest points reach respectively -115 (SEV 16BB5) and 35 m (SEV 03BB1S).
Analysis of longitudinal conductance maps
The longitudinal conductance CL is the thickness resistivity ratio in ohm-1. The maps of the conductive layer C and that of the intermediate layer A1 cover are drawn from the data of the quantitative interpretation indicated by the geoelectric sections. The equidistant used is 1 Ω-1.
Longitudinal conductance map of the conductive layer C
In the western part of the study area, the electrical sounding diagrams are similar to those of sounding 3 BB1S. They show the presence of conductor C, whose thickness varies little and remains between 100 m and 130 m. We notice three resistive and conductive layers, of which layer A is located between the curves 7 and 9 Ω-1, except the electrical soundings 3BB1S and 4BB1S, which indicate a resistivity between 13 and 16 Ω-1. Layer B is less conductive. Its longitudinal conductance values are less than 7 ohm-1. The minimum value reached is 4 Ω-1 at electrical soundings 10BB20, 10BB5 and 12BB20, this level could be of hydrogeological interest. The resistivity of the conductor C reached is greater than or equal to 30 Ω-1 the enrichment of the resistant past (sands) within this conductor is at the origin of the increase of resistivity, However, at the level of electrical sounding 4BB1 located along Wadi Guir, the value of the longitudinal conductance is 5 Ω-1 influenced by a thinning of the conductor C which reaches in these two cases 90 m thick and a more conductive level C or the longitudinal conductance is greater than 9 Ω-1, this value is related to the decrease in the resistivity of the conductor, which reaches at these three levels a value of 10 Ω.m. The increasing content of clays within this conductor is responsible for the increase in its longitudinal conductance, this is an area of hydrogeological interest but to a lesser degree than for levels A and B (Figure 12).
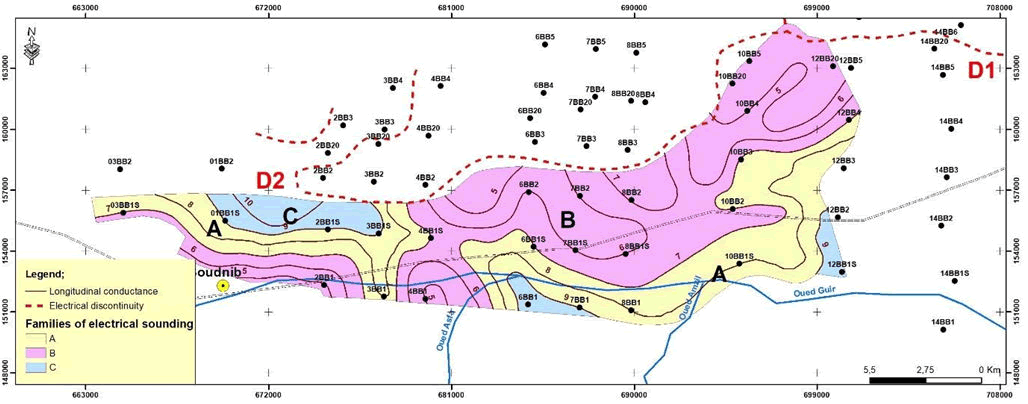
Figure 12: Longitudinal conductance map of conductor C.
Longitudinal conductance of the A1 level coverage
The longitudinal conductance A1 is present only in the family A of electrical soundings. The western part of the study area is subdivided into three levels of longitudinal conductance A1, the increase in its value, which generally exceeds 12 Ω.m, is influenced by the fall in the resistivity of the electrical levels R0 and C, This reflects the increasing content of clay elements within the level A1 cover and is, therefore a less favorable area for water exploitation.
In the western part of the study area, we find the three levels shown on the previous map with slightly higher values of longitudinal conductance. These levels such bounded by the 9 Ω-1 and 11 Ω-1 isovale curves, however, at Wadi Guir, the increase in the value of longitudinal conductance, which generally exceeds 12 Ω-1, is influenced by the drop in resistivity of the electrical levels R0 and C, this reflects the increasing content of clayey elements within the A1 level cover, particularly within the C conductor. It is concluded that this is a less favorable area for exploitation of the A1 level coverage. In the eastern part of the study area, a less conductive level (9 Ωm-5 Ωm) is found, this is mainly influenced by the increased resistivity of the different levels of the A1 cover. This is an area that remains to be explored as it could be of hydrogeological interest (Figure 13).
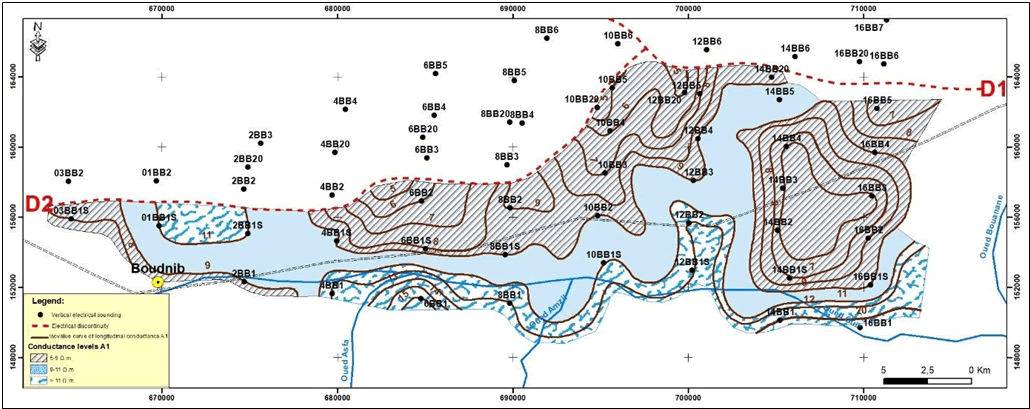
Figure 13: Longitudinal conductance map of A1 level coverage.
Conclusion
This study reflects the interest in geophysical data for the knowledge of the geometry and structure of aquifers of the Boudenib basin. The interpretation of these data has highlighted two electrical discontinuities D1 and D2, the first of which coincides with the core of an anticline (ramp folds), this anticline affects mainly the tertiary and whose plane of detachment is above the Turonian roof. The increase in resistivity of the conductive level C north of the D2 discontinuity is either of the lithological origins or induced by the disappearance in the north of the basin of an aquifer identified by drilling not far from the town of Boudenib.
This study has made it possible to obtain important information on the complex lithological global structure of the subsoil of the plain and define the different electrical horizons and their correspondences in geological terms, to draw up the map of the isohypses of the roof of the resistant substratum attributed to the limestone bar of the Cenomano-Turonian, which presents a great qualitative interest being able to assist in better knowing the structure of this deep aquifer in order to help the persons in charge to take good decisions as for the establishment of the exploratory or exploitation drillings.
References
- Asfahani J (2007) Geoelectrical investigation for characterizing the hydrogeological conditions in semi-arid region in Khanasser valley, Syria. J Arid Environ 68:31-52.
- Gouasmia M, Gasmi M, Mhamdi A, Bouri S, Dhia HB (2006) Geoelectric prospecting for the study of the thermal aquifer of reef limestones, Hmeïma-Boujabeur (West Center of Tunisia). Geo Sci 338:1219-1227.
- Zouhri L, Gorini C, Deffontaines B, Mania J (2004) Relationships between hydraulic conductivity distribution and synsedimentary faults, Rharb-Mamora basin, Morocco; hydrogeological, geostatistical and modeling approaches. Hydrogeol J 12:591-600.
- Toto EA, Kaabouben F, Zouhri L, Belarbi M, Benammi M, et al. (2008) Geological evolution and structural style of the Palaeozoic Tafilalt sub-basin, eastern Anti-Atlas (Morocco, North Africa). Geol J 43:59-73.
- Guellala R, Inoubli MH, Amri F (2009) New elements on the structure of the Ghardimaou superficial aquifer (Tunisia): Electrical geophysics results. Hydrol Sci J 54:974-83.
- Margat J (1954) Current sedimentation by spreading of flood waters in the palm groves of Tafilalt (pre-Saharan Morocco), in Comptes-Rendus de la xe General Assembly of the Union of Geodesy and Geophysics. Rome 192-193.
- Choubert G, Faure-Muret A (1962) Evolution of the moroccan atlas domain since paleozoic times. Geological Society of France, Paris 1:447–527.
- Dresnay D (1975) Extension and development of Jurassic reef phenomena in the Moroccan Atlas domain, particularly in the middle Lias. Bull Soc Geol Fr 7:46-56.
- Michard A (1976) Elements of moroccan geology. Notes Memoirs Geological Service 252-408.
- Chamayou J, Ruhard JP (1977) Pre-African furrow East of Siroua: Ouarzazate and Errachidia Boudenib basins water resources of Morocco, Water Resources 24-42.
 Spanish
  Chinese
  Russian
  German
  French
  Japanese
  Portuguese
  Hindi
Hindi 