Research Article, J Comput Sci Technol Vol: 12 Issue: 3
Greenhouse Monitoring and Control System
Usman Saleh Toro*
Department of Computer Science and Software Engineering, Shenzhen University, Shenzhen, China
*Corresponding Author: Usman Saleh Toro, Department of Computer Science and Software Engineering, Shenzhen University, Shenzhen, China, Tel: 234 8063531320,
E-mail: usmansalehtoro@gmail.com
Received: 11 May, 2020, Manuscript No. JCEIT-21-10659;
Editor assigned: 14 May, 2020, PreQC No. JCEIT-21-10659 (PQ);
Reviewed: 28 May, 2020, QC No. JCEIT-21-10659;
Revised: 03 Aug, 2022, QI No. JCEIT-21-10659 (QI); Manuscrip t No. JCEIT-21-10659 (R);
Published: 31 Aug2, 022, DO I: 10.4172/2324-9307.1000236
Citation: Usman Saleh Toro (2022) Greenhouse Monitoring and Control System. J Comput Sci Technol 11:8.
Abstract
Green house environment, used to grow plants under controlled climatic conditions for efficient production, forms an important part of the agriculture and horticulture sector. To create an optimal environment the main parameters such as temperature, humidity, light intensity, ground water, etc. needs to be controlled. The main objective of this project work is to design an automated greenhouse which is purely sensor-based system. The system takes inputs from various sensors, displays the values, and trigger actuators accordingly to control the microclimatic conditions. The developed system is simple, cost efficient and easily installable. The result shows that the system could be more efficient in man power saving and raising the economic value of products.
Keywords: Greenhouse, Climatic condition, Temperature, Humidity, Microclimatic, Ground water
Introduction
Greenhouses are good for off-season farming. Farmers can grow their choice of crops all year round even when their natural seasons are over. Especially implemented in fruit and vegetable or flower gardens, plants can be grown all year long without concern about the high temperatures experienced during the dry season. But traditional greenhouses are hard work. They demand constant attention and carethe farmer must always be on site to control the environment of the greenhouse manually-from watering to lighting to humidity regulation. This is particularly challenging if the farm site is far from their place of residence. The yield ultimately may not be worth the time and money invested into the farm. The most important factors for the quality and productivity of plant growth are temperature, humidity and light intensity. Continuous monitoring of these parameters will provide for means of controlling the microclimatic conditions of the greenhouse thus eliminating any need for manual intervention [1].
A low-cost greenhouse that uses open source control systems designed for use in rural communities. The microcontroller and structure of the greenhouse system were designed to enable optimized growing conditions for crops such as tomatoes, capsicum, and onions. The subsystems of the farm are; rainwater catchment system that supplements water supply, the solar panel and battery packs to power the electronics, the control system that uses an Arduino for monitoring and controlling the microclimate parameters such as; temperature, humidity, and soil moisture. A network included in the design allows for offsite control, and enables users to receive alerts and transmit commands to the control system. This system is specially designed for rural environments where power outages are regular, in that a solar panel and battery array is incorporated in the design. The program is set to run every 20 minutes during daylight hours to gather enough information to properly maintain the environment, while minimizing power usage. Also, a great amount of work was put into the design of the greenhouse structure. This would ensure that the system would stand against heavy rains, high winds and other extreme weather conditions. The rainwater catchment is especially impressive as it almost eliminates the need for additional water source. All these make the system versatile and cost-effective, although there is no room for modification of the system after it has been programmed and making it only suitable for one crop [2].
A Wireless Sensor Network (WSN) that measures a great deal of parameters. It uses an array of sensors connected to a single sensor board. The sensor board tallies all the sensor values at various locations and controls the actuators taking into account the position of the sensors. This implementation would be ideal in very large greenhouses where different regions have different microclimates or various crops are grown. It is proposed to design WSN to analyze the natural ventilation, heating systems, screen control and sprinkler control as a primary control objective. Humidity, Soil temperature, Daylight and CO2 control as a secondary control. Due to the rising number of crops being grown in greenhouses, the number of parameters to be controlled is ever increasing. This system sought to provide a wireless sensor network with additional hardware and software for an efficient solution to greenhouse control. In practice, it is a good system that works on low power and would be very versatile.
An automated wireless drip irrigation system that uses linear programming technique to provide a real time feedback control system that monitors and controls all the activities of a drip irrigation system efficiently. The system also includes a water management subsystem that makes sure that the system does not waste water, thereby reducing cost and increasing profit. Using this system, one can save manpower, as well as water to improve productivity and ease the labor needed. This system also has a fertilizer dispensing system that analyzes the plant using advanced image processing techniques to determine which nutrient is lacking in the plant. It then mixes the fertilizer depending on the results obtained. This system is advanced and would cost a lot of money to implement and maintain [3].
The system designed in this project measures and interpret the data read from the sensors using the microcontroller for microclimatic conditions of a greenhouse. It also uses actuators to regulate the climatic conditions to some pre-set values based on the optimum conditions for the growth of crops and is able to monitor the climatic conditions of the greenhouse farm from anywhere in the world with an internet connection.
Materials and Methods
System architecture and hardware design
The system can be broadly categorized into:
Power supply unit: This supply the power needed for the circuit to run. It supplies 5 V to the control unit, 15 V to the relay unit, and, 240 V to some of the actuators.
Sensing unit: This comprises of all the sensors that measure the parameters of the microclimate of the greenhouse and sends them to the processing unit, which include the light sensor, temperature and humidity sensor, soil moisture sensor and gas sensor.
Processing unit: This is the brain of the circuit. It consists of the microcontroller that takes decisions based on the program uploaded to it, the Wi-Fi module that connects the circuit to the internet, and so on (Figure 1).

Figure 1: System block diagram.
Actuator unit: Consists of all the hardware that is used to bring those parameters measured by the sensing unit to the desired range.
Display unit: This is twofold; It consists of an LCD that shows the status of all sensors and actuators, and also, the mobile device that collects the same data over the internet and shows it to the user remotely (Figure 2) [4].

Figure 2: Circuit diagram of the hardware.
System flowchart and software design
When the system is initialized, the microcontroller initializes the ESP8266, which starts by looking for the Wi-Fi network whose name was specified in the program burnt onto its chip. Once it finds that network, it inputs the password, also as given in the program. It then accepts data from the sensors using its on-board microcontroller, and consequently sends the data to the connected mobile device over the network it has connected to earlier with a delay of 15 seconds. The microcontroller only sends data to the device when the device is available so as to save power and bandwidth [5].
The microcontroller then checks the data received from the sensor unit and compares them to the threshold values specified and proceeds to turn on or off the respective actuator based on that. This is done in an instant with no considerable delay.
Next, is the primary (on-board) display–a 16 × 2 Liquid Crystal Display (LCD)–which also receives its data from the microcontroller and also indicates the status of each of the actuators (Figure 3).

Figure 3: System flowchart.
Results and Discussion
This project can be broadly divided into 5 main parts; the power supply, the control unit, the sensor array, actuators and display unit. First, we design a power supply system that converts an AC mains supply to DC to power all the components; This involved stepping down 240 V to 12 V by the transformer, full wave rectification by the use of 4 diodes, and finally, regulating the DC voltage to 12 V, then to 5 V and finally to 3.3 V using three voltage regulators. Next, the sensor array was used to measure 5 main greenhouse farm parameters, namely; humidity, temperature, light intensity, gas content and soil moisture content. They do this with varying degrees of accuracy as was thoroughly discussed in the previous chapter. The data they provide are not exactly usable by the operator, since they are sent out as a string of varying voltages. They have transmitted to the microcontroller, which uses the software uploaded to it to make the data usable [6].
The control unit consists of the microcontroller and the multiplexing unit. The microcontroller is the brain of the system. It takes data from the sensors, processes it, and sends commands to the actuators. It also controls the Internet of Things (IoT) aspect of the system as it features a Wi-Fi module inside. The multiplexing unit (ADS1115)-as the name implies- takes data from all 3 sensors and converts them to one serial stream, then sends it to the microcontroller for processing. Subsequently, the actuators (fan, bulb and water pump) are employed to return the parameters measured to the desired level. Their state (on or off) is determined by the program written onto the microcontroller. Finally, all results from the sensors, the state of the actuators, and other relevant data are displayed in two instances; Onsite on the LCD and on any activated smartphone over the internet, anywhere in the world (Figure 4).

Figure 4: Percentage deviation of power output from theory.
Power supply
Results from the power supply unit were taken by the use of a multimeter, before any load was placed on it so as to get more accurate results (Table 1).
Table 1: Power supply output.
We notice from the results above that although there are differences between theoretical values and the actual values measured, there is no cause for alarm as they are all single digit percentages, thus, insignificant. This minute difference is due to a number of reasons, the most noteworthy are:
• Current draw of various power supply components such as, diodes, capacitors, etc.
• Error in measuring devices. e.g. Multimeter, Oscilloscope and so on.
Sensors: Results from the sensors were obtained from three sources; The Arduino IDE serial monitor, the LCD and the Blynk software on our smartphone. All these results are important to both everyday use as well as troubleshooting of the system. The serial monitor result being the one for troubleshooting, the LCD results for on-site monitoring and finally the IoT Blynk software results for use while off-site [7].
DHT11 temperature and humidity sensor: The data presented below are sample values measured from the system for the 6th of January, 2020 (Table 2 and Figures 5-9).
Table 2: Temperature sample data.

Figure 5: Temperature outputs over time.
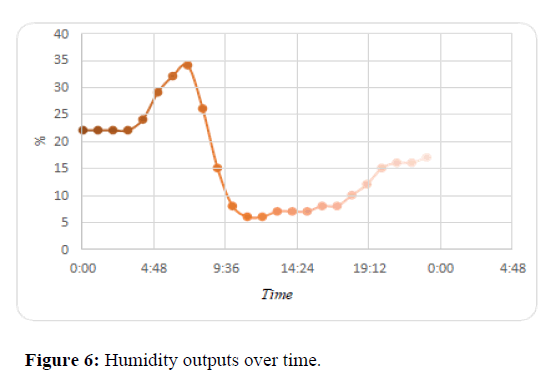
Figure 6: Humidity outputs over time.
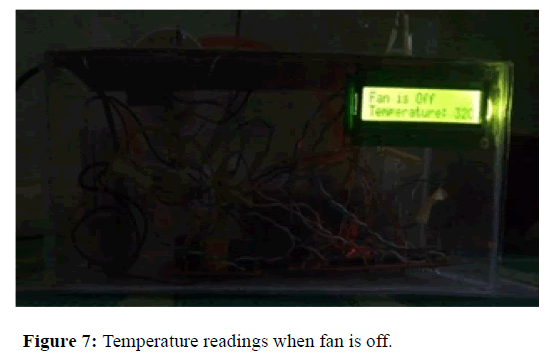
Figure 7: Temperature readings when fan is off.
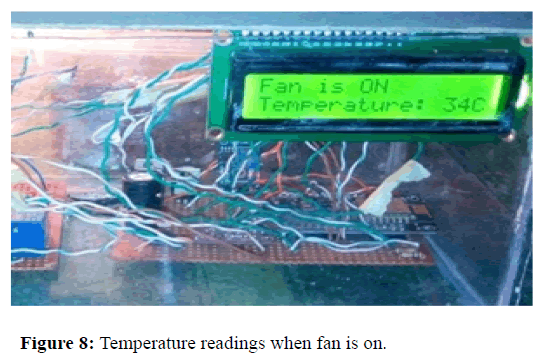
Figure 8: Temperature readings when fan is on.

Figure 9: Blynk dashboard.
It can be observed that the DHT11 is very well capable of measuring temperature and humidity values within and well beyond this range.
Discussion
Light dependent resistor
When placed in an open place, with direct access to sunlight and the microcontroller set to switch on the light bulb at less than 40% brightness. It was observed that the switching happened usually at about 6:12 pm give or take a few minutes.
Also, the light bulb switched off at 5:45 am (at about first light). One thing to note is that the thresholds set for switching would depend on the type of plants being cultivated in the greenhouse and their specific climatic needs (Figures 9-12).
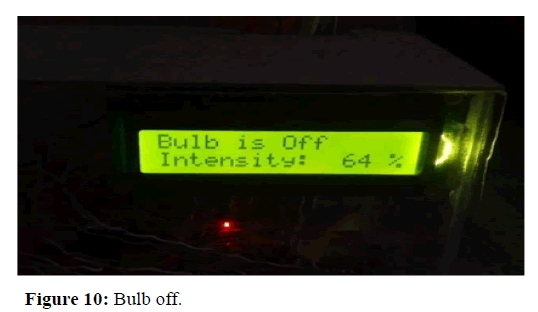
Figure 10: Bulb off.

Figure 11: Light intensity at 28% (bulb on).

Figure 12: Fan on.
Soil moisture sensor
To measure this, we set the moisture sensor probes in dry soil. This immediately set the water pump ON. Watering continued for about a minute before the soil got to 60% moisture content. It took exactly 4 hours for the soil moisture content to drop below the threshold of 30%. The pump came on again but this time took less than 30 seconds to reach the same 60% moisture content. And so on, over and over again for the test period of 24 hours (Figures 13, 14) [8].

Figure 13: Blynk dashboard (bulb off).

Figure 14: Soil moisture at 76% (pump off).
Conclusion
The aim and objectives of this project were achieved following the design methodology stated in this report. The climatic conditions were measured to a degree of accuracy afforded by the sensors used. The data received from those sensors were then used to toggle actuators in order to return the parameters to the desired levels. Also, the system was fully integrated to the Internet of Things cloud, enabling us to control and monitor the conditions of the greenhouse at any moment, anywhere.
Scope for Further Development
A few recommendations can be made to improve this project:
• Incorporation of data collection to enable analytics for better crop conditioning.
• Use Raspberry Pi for faster processing.
• Use of more accurate sensors for more precise measurements.
• Provision of an alternate power source, such as a solar source, to supplement power from the grid.
• A look into more power efficient components so as to improve thermal efficiency.
References
- Boimau I, Endarko E (2015) Designing a telemetry system of temperature and soil moisture for irrigation control. Appl Mech Mater 771: 38-41.
- Groener B, Knopp N, Korgan K, Perry R, Romero J, et al. (2015) Preliminary design of a low-cost greenhouse with open source control systems. Procedia Eng 107: 470-479.
- Jayasuriya YP, Elvitigala CS, Wamakulasooriya K, Sudantha BH (2018) Low cost and iot based greenhouse with climate monitoring and controlling system for tropical countries. ICSSE 1-6.
- AkkaÅ? MA, Sokullu R (2017) An IoT-based greenhouse monitoring system with Micaz motes. Procedia Comput Sci 113: 603-608.
- MaksimoviÄ? M (2018) Implementation of fog computing in IoT-based healthcare system. J Inf Technol 14: 100-107.
- Chowhan RS, Dayya P (2022) Sustainable smart farming for masses using modern ways of internet of things (IoT) into agriculture. 531-556.
- Yusof YM, Islam AM, Baharun S (2015) An experimental study of WSN transmission power optimisation using MICAz motes. ICAEE 182-185.
- Rupali S, Hemant G, Shoaib K, Aaditya I, Deep D (2018) IOT based greenhouse monitoring system. Int J Appl Sci Eng 6: 2084-2085.
 Spanish
  Chinese
  Russian
  German
  French
  Japanese
  Portuguese
  Hindi
Hindi 