Spanish
  Chinese
  Russian
  German
  French
  Japanese
  Portuguese
  Hindi
Hindi Research Article, J Biodivers Manage Forestry Vol: 13 Issue: 2
Forest Fire Risk Modelling Using Satellite Imagery and GIS Technique in Kohima, Nagaland, India
Arunima Nandy, Bisworanjan Behuria, Manoj Kumar Meher*, Primia Taifa and Sagarika Barua
Department of Geography, North-Eastern Hill University, Shillong, Meghalaya
*Corresponding Author:Manoj Kumar Meher Department of Geography, North-Eastern Hill University, Shillong, Meghalaya, Tel: + 919861443980; E-mail: meher.manoj@gmail.com
Received date: 27 July, 2022, Manuscript No. JBMF-22-70570; Editor assigned date: 29 July, 2022, PreQC No. JBMF-22-70570 (PQ); Reviewed date: 12 August, 2022, QC No. JBMF-22-70570; Revised date: 04 October, 2022, Manuscript No. JBMF-22-70570 (R); Published date: 10 October, 2022, DOI:10.4172/2327-4417.1000256.
Citation: Bhandari MS, Meena RK, Dabral A, Chauhan JS, Pandey S (2022) Forest Fire Risk Modelling Using Satellite Imagery and GIS Technique in Kohima, Nagaland, India. J Biodivers Manage Forestry 11:6.
Abstract
Fire in forested areas is considered an environmental disaster that is triggered by either natural forces or anthropogenic activities. Control of fireside is troublesome, however it’s possible to map fire risk by geospatial technologies and thereby minimize the frequency of fire occurrences and damages caused by fire. The present study carried out in Kohima district, Nagaland, North-east of India for the history of major forest fire hazard in forested and grassland areas. In this study, the forest fire risk zonation map has been prepared to minimize fire risk and develop Forest Fire Risk Index (FFRI) to delineate the fire risk in Kohima District, Nagaland that is subjected to the frequent forest fire. Slope, aspect, DEM, NDVI, temperature, relative humidity, wind force and LanduseLandcover (LULC) are used as the factors influencing forest fire. These indices were set up by assigning subjective weight values to the classes of the layers based on the sensitivity ratio to fires.
Keywords
Forest fire risk; Environmental disaster; Slope; Aspect; DEM; Landuse-landcover
Introduction
The forest fire is an environmental disaster consisting of fire which destroys a forested area and can be a great danger to people as well as flora and fauna and affects many lives and livelihood, those who live and depend on forests. The forest fire is considered as a frequent and constant natural disaster in the forest ecosystems and one of the major disasters that have a tremendous impact on humans and wildlife, environment, ecosystem, weather and climate [1]. A very helpful component in operational fire risk assessment is the use of remote sensing to detect wildfires in near real-time as well as to identify those areas already burned for creating a history of fire events. Satellites have been used for more than two decades to monitor fire activity across the globe. The slash and burn shifting cultivation or locally known as Jhum, the predominant form of agriculture in the hill tracts of North East India is found to be the major cause of forest fire in the region. The fire in northeast India mostly pertain to slash and burn agriculture [2,3]. North-east part of India, which suffers maximum from the fires due to age-old practices of shifting cultivation and spreads fires from the Jhum fields, need immediate attention with respect to forest fire as well as developing an early warning system.
Such areas require stratification in terms of vulnerability of vegetation types of forest, so as to ensure greater attention on the location of forest fire [4]. The present study attempts to utilize the capabilities of remote sensing and GIS to detect forest fire prone areas through weightage overlay method and forest fire risk modelling in Kohima district, Nagaland which is highly prone to forest fire in North-east India.
Kohima is selected purposively, a hilly region which has been infamous for forest fire and its losses in the past in Nagaland. People out their mainly depend on agriculture in the region and they mostly do shifting cultivation, terrace cultivation for which they burn down some part of forest area and also in order to clean the bushes. The wind velocity is high of the area which triggers spreading of fire easily over the forest. Mostly the forest fire occurs during the dry season due to less rainfall and vegetation remains dry in the region, from this point of view in order to prevent and predict the forest fire, forest fire zonation and assessment is necessary so that the local area management can take pre-action to meet rather than wait for the disaster to happen. This study aims to identify the forest fire risk zones and prepare a forest fire risk zonation map of Kohima District, Nagaland.
A precise evaluation of forest fire problems and decision on solutions can only be satisfactory when a fire risk zone mapping is available [5]. Geospatial technology, including remote sensing and geographic information systems, provides the information and the tools necessary to develop a forest fire susceptibility map in order to identify, classify and map fire hazard area [6]. Geospatial modelling included a lot of information about the settlements, road, elevation and all the other parameters which are very useful when forest fire preparedness and management strategies are designed [7].
Kohima, is a hilly district of India's North-Eastern State of Nagaland, sharing its borders with Assam State and Dimapur district in the West, Phek district in the East, Manipur State and Peren district in the South and Wokha district in the North. Kohima is located at 25º40'N 94º07'E 25.67ºN 94.12ºE. It has an average elevation of 1261 meters (4137 feet). Kohima is characterized by a moderate humid subtropical climate. It has a pleasant and moderate climate not too cold in winters and pleasant summers. December and January are the coldest months when frost occurs and in the higher altitudes, snowfall occurs occasionally. During peak summer months from July-August, temperature ranges an average of 80-90 Fahrenheit and heavy rainfall occurs during summer (Figure 1).

Figure 1: Location map of the study area.
Kohima endowed with a wide variety of forest type such as tropical wet evergreen forest, tropical semi evergreen forest, Northern Montane wet-temperate forest, temperate forest mainly due to land elevation ranging from few hundred meters up to thousand meters. The main occupation of the people of this area is agriculture and the method is old and traditional which they mostly practiced in the form of terrace cultivation, shifting cultivation or Jhum cultivation. Jhum or shifting cultivation is done near the slope by burning down a piece of land covered with vegetation and thus Jhum practice is the main cause of the forest fire in the region. The outbreak of forest fire mostly take place during the dry winter seasons due to less rainfall and also due dry vegetation cover. The area is being in high altitude the wind force is high, the speed of wind increases during dry season and which made fire to spread easily in large area.
As the forest fire is common hazard in the region which affect the animals, birds also disturbs the ecosystem of the forest. Therefore in order to prevent the forest fire outbreak, it is necessary to identify the location of forest fire occurrence and to do zonation of the fire area in order to predict future fire in the region. The past forest fire record is an important aspect which gives an idea about the location of the forest fire. It is most important to identify the factors which are related with forest fire within the study area. The broad aim of the paper is to identify the location of the forest fires of Kohima District and prepare forest fire zonation map of the study area.
Materials and Methods
Landsat 8 OLI (2nd Feb 2017) satellite imagery has been collected from United States Geological Survey (USGS) earth explorer for analysis of land use land cover and vegetation growth of the study area. ASTER DEM has been collected from USGS earth explorer to prepare elevation, slope and aspect map. Climatic data (wind force, temperature, relative humidity) of the study area has been collected from the Indian meteorological department. History of forest fires data has been collected from sate disaster management of Nagaland to identify the locations of past forest fires in the study area. Besides, other ancillary data has been collected from GIS remote snsing centre Nagaland and department of environment, forest and climate change Kohima, Nagaland.
Parameters used
The parameters that are responsible for forest fire risk and thus used in this study to calculate fire risk are as follows:
Terrain parameters: The slope is the measure of steepness or the degree of inclination of a feature relative to the horizontal plane.
Gradient, grade, incline and pitch are used interchangeably with the slope. The slope is typically expressed as a percentage, an angle or a ratio. To find the slope of a feature, the horizontal distance (run), as well as the vertical distance (rise) between two points on a line parallel to the feature needs to be determined. The slope is one of the parameters that influence fire spread rate [8]. Fire moves more quickly up the slope and less quickly downslope [9]. Fire spread rate also may rise on steeper slopes due to flames being angled closer to the ground surface and the process of heat convection can be enhanced by wind effects due to fire behaviour [10].
Aspect identifies the downslope direction of the utmost rate of change in value from each cell to its neighbours’. It can be said as slope direction. The value of each cell in the output raster indicates the compass direction that the surface faces the location. Aspect is related with the quantity of solar energy a region receives. South aspects experience more sunlight, higher temperatures, robust winds, low humidity and low fuel moistures in the Northern hHemisphere. Therefore, vegetation is typically drier and less dense on south-facing slopes than north-facing ones [11,12]. Because of that, drier fuels are more exposed to ignition [13].
Digital Elevation Model (DEM) is a digital model or 3D illustration of a terrain’s surface. DEM is often used as generic term for Digital Terrain Model (DTM) and Digital Surface Model (DSM). The elevation is a crucial physiographic variable that is associated with temperature, moisture and wind. Therefore, it has an important role in fire spreading. Elevation influences vegetation structure, fuel moisture and air humidity [14]. It has been analysed that humidity and temperature have a higher influence on fire at higher-altitude areas than lower ones [15]. It has also been reported that fire behaviour trends are less severe at higher altitude because of higher rainfall and based on the confidence level of relationships, these indicators have been monitored [16]. For example, noted that elevation is an important predictor of fires in the Deccan India which has been attributed to slash and burn agricultural practised that are mostly practiced by the indigenous people in the higher elevated areas.
Biophysical parameters: The normalized vegetation index is a simple graphical indicator that can be used to analyze remote sensing measurements, typically, but not necessarily, from a space platform and assess whether the target being ascertained contains live green vegetation or not. For the present study, Landsat 8 OLI (2nd Feb 2017) satellite imagery has been collected for analysis of Normalized Difference Vegetation Index (NDVI).
The biophysical parameter land use land cover has been used in this study. Land cover corresponds to the physical conditions of the ground surface, for example, forest, grassland etc. while land use refers to features of the land surface, which may be natural and semi-natural well as man-made for example building, roads, ponds, agricultural field etc.
Meteorological parameters: Change in weather parameters such as temperature, rainfall, humidity and wind speed are important indicators of fire. Force of the wind on a structure, object proportional to the square of wind speed. Wind force map identifies the direction of the wind in a different location. Temperature refers to the degree of hotness and coldness of the air. It varies throughout the day in a place.
It varies from place to place. Relative humidity is the ratio of the partial pressure of water vapour to the equilibrium vapour pressure of water at a given temperature. Relative humidity depends on temperature and therefore the pressure of the system of interest.
Methodology adopted: For the compilation of the work both quantitative and qualitative methods of analysis have been used. It has been completed in three phases: Pre field, field investigation and post field work. Firstly, during pre-field work, study sites were selected and vulnerable areas were identified. Data were collected from various relevant secondary sources. Secondly, during field investigation forest fire areas were observed, ancillary data from the sate disaster management of Nagaland, GIS and remote sensing centre Nagaland and department of environment, forest and climate change Kohima, Nagaland were collected. Lastly, during post field work tabulation, classification and analysis of data using general mathematical and statistical principles were done. Different thematic maps were prepared for the purpose of analysis. After analyzing the factors, forest fire zonation map was prepared. Different thematic layers of the factors which responsible for the assessment of forest fire in the region were prepared by using ArcGIS 10.3 and ERDAS EMAGINE 9.1 software. Based on GIS environment forest fire risk zonation map was prepared. All the thematic layouts are reclassified for data integration.
The data integration has been done by applying Weighted Overlay Method (WOM). According to the relative importance of the factors weightage has been given for each factor. The values are assigned from 1-9. After WOM, forest fire risk zonation map has been prepared.
The formula for weightage overlay:
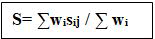
Where,
wᵢ is the weight of ith factor map,
sᵢj is the weight of jth factor map of the spatial class of I,
S is the value of output result
The Forest fire risk model which has been developed in this study adopted from Hamed 2013. Modeling was conducted by using Arc GIS software by computing the factors responsible for influencing the fire behavior. An integrated analysis was performed by combining the inputs and multiplying them with their specified weight, where a weight is a value assigned to variable that indicate the importance relative to variable. The variable with higher degree of influence on the fire risk was given the higher weightage. Subjective weights were given to the different classes according to their sensitivity to fire or their fire inducing capability (Figure 2). The weightage of each factor has been slightly interchanged to check the relative effects of each factor, while vegetation growth (NDVI) was same at both weightage overlay method and forest fire risk index because of its strength in both the method adopted. The equation used in the GIS environment for the forest fire risk modeling is:

Where,
Vg=Vegetation Growth (NDVI),
LULC=Land Use Land Cover,
WF=Wind Force,
Temp=Temperature,
D=DEM,
S=Slope,
RH=Relative Humidity,
A=Aspect.

Figure 2: Overall methodology adopted to produce forest fire risk map of the Kohima district.
Results
The terrain parameters used in this study are slope, aspect and DEM. Slope map which is showing the angle of slope of Kohima district, Nagaland. The map has been prepared using Digital Elevation Model (DEM). The elevation of the surface is being calculated in degrees. The below Figure 3 shows that Kohima is a hilly area and the area covers very high slope is 15.06 percent, low slope angle covers 32.29 percent of the area. Very low, moderate and high covers 21.84 percent, 19.32% and 11.48% of the study area respectively. Figure 4 representing surface analysis showing the aspect of Kohima District, Nagaland. The map has been prepared by using the Digital Elevation Model (DEM). It is indicating the direction of the slopes. In the South Western part, the slope is directed to North Western side. In the Southern part, most of the slope direction is to north and west direction. Western direction is the most prominent for forest fire. It covers 21.55 percent of the study area, whereas the flat, north, east and south direction is 22.26, 19.62, 17.79 and 18.79 percent respectively (Table 1). Figure 5 is a Digital Elevation Model of Kohima District, Nagaland. The map is showing the elevation of the study area, the high elevation covers in the southern part and covers only 3.48 percent of the area. The area is mostly falls under low elevation and covers 52.67 percent. In the southern part, the area falls under moderate, high and very high elevation and the Dzokou Valley is falls under the same (Table 2).

Figure 3: Slope map of Kohima district.

Figure 4: Aspect map of Kohima district.

Figure 5: DEM of Kohima district.
| Aspect | LULC | ||||
|---|---|---|---|---|---|
| Direction | Area (in sq.km) | (In %) | Classes of LULC | Area (in sq.km) | (In %) |
| Flat | 328.74 | 22.26 | Moderate Vegetation | 407.69 | 27.61 |
| North | 289.78 | 19.62 | Waterbody | 50.58 | 3.42 |
| East | 262.55 | 17.79 | Fallow Land | 387 | 26.21 |
| South | 277.45 | 18.79 | Dense Vegetation | 522.95 | 35.41 |
| West | 318.26 | 21.55 | Settlement | 108.59 | 7.35 |
| Total | 1476.78 | 100 | 1476.81 | 100 | |
Table 1: Details of Aspect and LULC affecting forest fire in Kohima district, Nagaland.
| Slope | NDVI | DEM | Wind Force | Temperature | Relative Humidity | |||||||
|---|---|---|---|---|---|---|---|---|---|---|---|---|
| Class | Values (in*) | Area (in sq.km) | (In %) | Value | Area (in sq.km) | (In %) | Elevation (in*) | Area(in sq.km) | (In %) | Value (in km/hr.) | Value (in °C) | Humidity (in*) |
| Very low | <10 | 322.59 | 21.84 | <0.6 | 21.4 | 1.45 | <500 | 240.63 | 16.29 | <2.3 | <19 | <71 |
| Low | 476.85 | 32.29 | 0.6-0.18 | 139 | 9.44 | 500-1500 | 777.89 | 52.67 | 2.3-2.5 | 19-20 | 71-73 | |
| Moderate | 30-50 | 285.4 | 19.32 | 0.18-0.30 | 710 | 48.08 | 1500-2000 | 283.01 | 19.16 | 2.5-2.7 | 20-21 | 73-75 |
| High | 50-70 | 169.59 | 11.48 | 0.30-0.42 | 563 | 38.09 | 2000-2500 | 123.95 | 8.39 | 2.7-2.9 | 21-22 | 75-77 |
| Very high | >70 | 222.46 | 15.06 | >42 | 43.5 | 2.94 | >2500 | 51.45 | 3.48 | >2.9 | >22 | <77 |
| Total | 1476.9 | 100 | 1477 | 100 | 1476.9 | 100 | ||||||
Table 2: Details of Slope, NDVI, DEM, wind force, temperature and relative humidity affecting forest fire in Kohima district, Nagaland.
The biophysical parameters used in this study are NDVI and LULC. Figure 6 is showing vegetation condition of the study area.
Very high shows healthy vegetation covers 2.94% and it’s found in the southern part. The study area is mostly dominated by moderate vegetation which covers 48.08% and identified in the middle part of the area, high vegetation covers 38.09 percent and identified only in the western part and very low covers only 1.45% and it falls under settlement area. From the above Figure 7 it has been observed that the eastern part of the area covers fallow land. The north western part is covered with moderate vegetation and it covers 27.61% of the study area. In the middle portion the settlement covers 7.35% of the area and forest Fire location is found in the moderate vegetation covers.

Figure 6: NDVI Map of Kohima district.

Figure 7: LULC Map of Kohima distrtict.
The meteorological parameters used in this study are wind force, relative humidity and temperature. From the above Figure 8 it has been observed that the northeastern part is dominated by high wind force (2.7-2.9) and very high (>2.9) wind force and also towards southern part the speed of wind is strong, whereas throughout the region it is very low, low and moderate i.e. <2.3, 2.3-2.5 and 2.5-2.7 respectively. High wind force is one of the most triggering factors for forest fire over the region and in high altitude. Wind force is usually strong which influence the cause of fire. Figure 9 represents the temperature of Kohima, Nagaland of 2017. From the map it has been noticed that central part of Kohima experience the high temperature (above 22°C) comparing to the other region. Figure 10 has shown the relative humidity of Kohima, Nagaland for the year of 2017 with the help of interpolation method and the data are in degree. The humidity is observed to be highest i.e. above 77° in the Southwestern part and the North-Eastern part of the region.

Figure 8: Wind force map of Kohima district.

Figure 9: Temperature map of Kohima district.

Figure 10: Relative humidity map of Kohima district
Discussion
Generally, forest fire management contains four steps of analysis and assessment of effective response to fires, namely, both potential fire hazard and risk, detecting hotspots, monitering active fires and assesing post-fire degradation [17]. Determining fire risk is the most important steps because knowing where the risk is highest is essential to minimize threats to life, property and natural resources [18]. Therefore, this study focused on determining geographic ditsribution or zonation of fire risk in Kohima which is highly prone to forest fire and prepared a location map of the forest fire by taking six fire points (while looking the history of forest fire locations and discussing with the officials of Nagaland State Disaster Management Board and opinions of locals).
Weighting of parameters
According to the weightage of each factor related with fire the weighted overlay method has been prepared depending upon the class and value of the same factor. The formula for weightage overlay has been calculated and has been discussed in the methodology part of this study. NDVI and LULC have been given weightage of 20 which are the only two biophysical factors used for the study affecting much to forest fire in the study area [19]. For the NDVI, in moderate class, percentage of area coverage is less compared to high class. We came to know while studying, that the sinario was different earlier, but now the rate of degradation is too high because of human intervention that dry patches of moderate vegetion casuing more forest fire comapred to dense vegetation (local peoples opinion have been taken into account with the data). In case of LULC, moderate vegetaion and fallow land have ranked 5 and high vegetation ranked 4 because its importance to forest fire in Kohima and while discussing with locals it has been found the same. The meterological indicators like wind force and temperature have given weightage of 15 because speed of the wind, and likely chances of forest fire is interrelated and so the temperature. Terrain indicators like slope and DEM have been weighted as 10, whereas aspect and relative humidity (meterological indicator) was weighted as 5. The slope and altitude had not much role to forest fire in the study area. Generally it was decreasing from valley to plain land. While looking at the data of relative humidity it has been observed that there was no such role, while very high class have been ranked 5, though have few chances as per the humidity contains in air [20]. Similarly aspect or direction wise there was no such effect in forest fire in Kohima, though these two have been included for the analysis (Table 3).
| Factors | Class | Value | Weight (in %) | Rank |
|---|---|---|---|---|
| Slope | Very Low | <10 | 10 | 1 |
| Low | 10-30 | 2 | ||
| Moderate | 30-50 | 3 | ||
| High | 50-70 | 4 | ||
| Very High | >70 | 5 | ||
| Aspect | High | Flat | 5 | 4 |
| Very High | North | 5 | ||
| Moderate | East | 3 | ||
| Very Low | South | 1 | ||
| High | West | 4 | ||
| NDVI | Very low | <0.6 | 20 | 1 |
| Low | 0.6-0.18 | 2 | ||
| Moderate | 0.18-0.30 | 4 | ||
| High | 0.30-0.42 | 5 | ||
| Very high | >42 | 3 | ||
| DEM | Moderate | < 500 | 10 | 3 |
| Very Low | 500-1500 | 1 | ||
| High | 1500-2000 | 4 | ||
| Low | 2000-2500 | 2 | ||
| Very High | >2500 | 5 | ||
| Wind Force | Very low | <2.3 | 15 | 1 |
| Low | 2.3-2.5 | 2 | ||
| Moderate | 2.5-2.7 | 3 | ||
| High | 2.7-2.,9 | 4 | ||
| Very High | >2.9 | 5 | ||
| Temperature | Very low | <19 | 15 | 1 |
| Low | 19-20 | 2 | ||
| Moderate | 20-21 | 3 | ||
| High | 21-22 | 4 | ||
| Very high | >22 | 5 | ||
| Relative Humidity | Moderate | <71 | 5 | 3 |
| Very High | 71-73 | 5 | ||
| High | 73-75 | 4 | ||
| Low | 75-77 | 2 | ||
| Very Low | >77 | 1 | ||
| LULC | Very High | Moderate Vegetation | 20 | 5 |
| Very Low | Water body | 1 | ||
| High | Fallow Land | 5 | ||
| Moderate | Dense Vegetation | 4 | ||
| Very Low | Settlement | 1 |
Table 3: Details of weightage and rank values.
Forest fire risk zonation and locating forest fire in Kohima District, Nagaland
After weighted overlay method, forest fire risk zonation map is prepared. The area has been classified into 3 zones e.g. low, moderate and high risk zone. Forest fire risk zonation map shows that high risk zone falls in the northern, South-east and western part of the study area. High risk covers 21.31 percent of the area. Moderate risk zone mostly dominated in the study area [21]. It covers 72.80 percent of the area, Settlement area falls under low risk zone. Figure 11, forest fire location map of Kohima District, Nagaland showing the area which is vulnerable to forest fire. The locations are superimposed in the zonation map of Kohima. It clearly shows that four points are falling under high risk zone and two points are falling under moderate risk zone. The areas which are under high risk are in the north-eastern, western and southern direction of the district. Similarly, in Figure 12, the map showing forest fire risk index with high, moderate and low risk zones [22]. The locations are superimposed in the map prepared by the methodology used for forest fire risk index.

Figure 11:Forest fire location map of Kohima district using weighted overlay method.

Figure 12:Forest fire risk index of Kohima district.
While comparing the values from WOM and FFRI, Table 4 shows there is 3.1% decrease in low class, 9.9% increase in moderate class and 6.8 percent decrease in high class of risk zone for forest fire in Kohima district, Nagaland [23]. The results for the FFRI is very close to the WOM method, though the values for each class varies a little and while total area for both remain same. The area calculated by WOM method for the low, moderate and high class is 86.61 sq. km, 1070.8 sq. km and 313.46 sq. km, while for FFRI the same class is 132.299 sq. km, 925.113 sq. km and 413.453sq. km. The change in area and difference in percentage observed because of the change in weightage for each factor which have been explained in methodology.
| Classes of Risk Zone | Adopted by WOM | Adopted by FFRI | Difference in percentage | ||
|---|---|---|---|---|---|
| Area (in sq.km) | In percentage | Area (in sq.km) | In Percentage | ||
| Low | 86.61 | 5.89 | 132.299 | 8.99 | -3.1 |
| Moderate | 1070.8 | 72.8 | 925.113 | 62.9 | 9.9 |
| High | 313.46 | 21.31 | 413.453 | 28.11 | -6.8 |
| Total | 1470.87 | 100 | 1470.87 | 100 | |
Table 4: Comparison of WOM and FFRI for forest fire risk zonation.
Validation of forest fire risk model
The forest fire zonation model is validated with the past records data and the field visit in the area and also information collected from the Nagaland State Disaster Management Board. The study area shows the distribution of the fire risk location is mostly in the northern, western and southern part of the Kohima district [24].
Conclusion
Forest fire risk zonation map has been prepared by computing the factors which highly influence the occurrence of fire. In the forest fire zonation map, it is observed that most of the area falls under the moderate risk which means the fire may likely to happen in future. The northern, western and the southern part of the district are in the high-risk zone. The Dzokou valley and Mount Japfu which is the common location of forest fire outbreak falls under high-risk zone towards the southern and western part of the district. By observing the results from both of the methods adopted in this study, it can be concluded that location falls nearly close over the risk zone mapped adopted by weighted overlay method. The model used for FFRI can be modified further and weightage can be given according to the importance of each factor. Further research is welcome in this area by researchers to restrict the forest fire in Kohima district, Nagaland.
The advancement of remote sensing and GIS in the field of disaster management not only predict and identified but also helps to locate the rescuing locations which will minimize the ongoing hazard event.
Forest fire risk zonation map which is prepared with multi-criteria analysis and weighted overlay method based on the importance and contribution of the factors in a fire outbreak. The map has been prepared in order to contribute management and the preventive measure of fire occurrence. With the help of fire risk zonation and other factors including forest density map, slope map, elevation map, preparedness for fire risk reduction and emergency rescue operation service can be set up for preventive measures including fire brigade, watch tower and helipad services. The findings of this study can help forest managers and forest agencies to locate high fire-risk zones or locations easily and take preventive policies and try to limit the loss of human life, natural resources and properties. Such maps also help in the planning of any infrastructure set up or road built up and also will help the forest departments in locating the fire zones and preventing it with fire rescuing equipment.
References
- Singh CP, Lele N (2014) Development of Forest Fire Risk Alarm System. ISG newsletter 20:26-31.
- Ramakrishnan PS (1998) Sustainable development, climate change and tropical rain forest landscape. Clim Change 39:583-600.
- Majumder M, Shukla AK, Arunachalam A (2011) Agricultural Practices in Northeast India and option for sustainable management. Biodivers biofuels agric Sustain Agric Rev 5:287-315.
- Puri K, Areendran G, Raj K, Mazumdar S, Joshi PK (2011) Forest fire risk assessment in parts of Northeast India using geospatial tools. J For Res 22:641.
- Jaiswal RK, Mukherjee S, Raju KD, Saxena R (2002) Forest fire risk zone mapping from satellite imagery and GIS. Int J Appl Earth Obs Geoinf 4:1-10.
- Sowmya SV, Somashekar RK (2010) Application of remote sensing and geographical information system in mapping forest fire risk zone at Bhadra wildlife sanctuary, India. J Environ Biol 31:969.
- Roy N, Porwal MC (2004) Forest fire risk zonation using geo-spatial modeling in part of Rajaji National park, India. Asian J Geoinf 5:40-46.
- Weise DR, Biging GS (1997) A qualitative comparison of fire spread models incorporating wind and slope effects. For Sci 43:170-180.
- Kushla JD, Ripple WJ (1997) The role of terrain in a fire mosaic of a temperate coniferous forest. For Ecol Manag 95:97-107.
- Neary DG, Klopatek CC, DeBano LF, Ffolliott PF (1999) Fire effects on below ground sustainability: A review and synthesis. For Ecol Manag 122:51-71.
- Prasad VK, Badarinath KVS, Eaturu A (2008) Biophysical and anthropogenic controls of forest fires in the Deccan Plateau, India. J Environ Manag 86:1-13.
- Anderson DH, Catchpole EA, De Mestre NJ, Parkes T (1982) Modelling the spread of grass fires. ANZIAM J 23:451-466.
- Noonan, EK (2003) A coupled model approach for assessing fire hazard at point Reyes national seashore: FlamMap and GIS. In Second international wildland fire ecology and fire management congress and fifth symposium on fire and forest meteorology, Orlando, FL. American Meteorological Society Nevada city, CA.
- Castro R, Chuvieco E (1998) Modeling forest fire danger from geographic information systems. Geocarto Int 13:15-23.
- Hernandez-Leal PA, Arbelo M, Gonzalez-Calvo A (2006) Fire risk assessment using satellite data. Adv Space Res 37:741-746.
- Chuvieco E, Congalton RG (1989) Application of remote sensing and geographic information systems to forest fire hazard mapping. Remote Sens Environ 29:147-159.
- Roy PS (2003) Forest fire and degradation assessment using satellite remote sensing and geographic information system. Satellite Remote sensing and GIS applications in agricultural meteorology 361-400.
- Adab H, Kanniah KD, Solaimani K (2013) Modeling forest fire risk in the northeast of Iran using remote sensing and GIS techniques. Nat hazards 65:1723-1743.
- Ayanz JSM, Gitas I, Camia A, Oliveira S (2011) Advances in Remote Sensing and GIS applications in Forest Fire Management From local to global assessments. JRC Scientific and Technical Report. European Commission, Ispra, Italy.
- Jain A, Ravan SA, Singh RK, Das KK, Roy PS (1996) Forest fire risk modelling using remote sensing and geographic information system. Curr Sci 70:928-933.
- Joseph S, Anitha K, Murthy MSR (2009) Forest fire in India: a review of the knowledge base. J For Res 14:127-134.
- Ozbayoglu AM, Bozer R (2012) Estimation of the burned area in forest fires using computational intelligence techniques. Procedia Comput Sci 12:282-287.
- Setiawan I, Mahmud AR, Shariff MAR, Nuruddin AA (2004) GIS-grid-based and multi-criteria analysis for identifying and mapping peat swamp forest fire hazard in Pahang, Malaysia. Disaster Prev Manag 13:379-386.
- Zhang, JH, Yao FM, Liu C, Yang LM, Boken VK (2011) Detection, emission estimation and risk prediction of forest fires in China using satellite sensors and simulation models in the past three decades-An overview. Int J Environ Res Public Health, 8:3156-3178.