Research Article, J Hydrogeol Hydrol Eng Vol: 13 Issue: 2
Forecasting Urban Water Escherichia coli Contamination Using Machine Learning Models
Vidhatri L. Iyer*
Department of Science, University High School of Indiana, Indiana, USA
*Corresponding Author: Vidhatri L. Iyer,
Department of Science, University High School of Indiana, Indiana, USA;
E-Mail: vid2008mp@gmail.com
Received date: 28 March, 2024, Manuscript No. JHHE-24-130903;
Editor assigned date: 01 April, 2024, PreQC No. JHHE-24-130903 (PQ);
Reviewed date: 15 April, 2024, QC No. JHHE-24-130903;
Revised date: 23 April, 2024, Manuscript No. JHHE-24-130903 (R);
Published date: 30 April, 2024, DOI: 10.4172/2325-9647.1000303
Citation: Iyer VL (2024) Forecasting Urban Water Escherichia coli Contamination using Machine Learning Models. J Hydrogeol Hydrol Eng 13:2.
Abstract
The state of Indiana ranks first in the nation for water recreation impairments due to contaminated waterways. According to U.S. Environmental Protection Agency, 73% of rivers and streams and 23% of lakes and reservoirs have recreational use impairments like swimming, fishing and boating. Increased density of urban population and agricultural activities are some of the key contributors to run-off into our urban watersheds. The fecal coliform bacteria Escherichia coli (E. coli ) have been used as an indicator of bacterial pollution in the water streams. Local governmental water authorities and non-profit organizations routinely collect samples of urban waters weekly (or biweekly) to measure water quality parameters including E. coli counts. These analytical methods are time-consuming and only provide retrospective analysis of E. coli loads. Thus, forecasting of E. coli contamination in urban waters is necessary to provide real-time information to the public about their suitability for bodily contact, recreation, fishing, boating, and domestic utilization. Another caveat of the current methods is the lack of integration of the local climatic conditions such as changes in temperature and precipitation. E. coli contamination in urban water streams was predicted utilizing the last 20 years of climatic factors (temperature, precipitation) and water sample analysis data. E. coli data was collected for three water streams from the Marion County (Indiana) watershed project for a period of 2003-2022. Daily temperature and precipitation data for Marion County were obtained from the National Oceanic and Atmospheric Administration site. These 2 sources of data were combined using the date field as a common parameter. An initial exploratory data analysis was performed to understand the correlation of parameters to E. coli levels. Next, additional calculated values such as cumulative degree days, max precipitation in 10 days or 15 days were included as input for 6 machine learning models (Logistic Regression, Random Forest Classifier, Extra Trees Classifier, Decision Tree Classifier, Gradient boosting Classifier and XGB Classifier). Feature importance analysis and overall accuracy scores across these 6 machine learning models were compared to identify the best model. XGB classifier consistently had ROC value of above 85% for 3 individual water streams.
Keywords
Urban water; E. coli; Contamination; Machine learning models; XGBoost; Cumulative degree days; Precipitation
Introduction
Water is a vital natural resource for our ecosystem. Water in creeks and watersheds not only provides pure water and habitats for aquatic life but also serves the agricultural industry, and everyday human purposes. Water quality is an important assessment that affects a multitude of organisms. Water that flows through urban watersheds is usually polluted with fecal bacteria and inorganic toxins. The main source of bacterial contamination is fecal coliform bacteria which enter watersheds due to poorly maintained sewage and storm water systems. An increase in the density of the urban population has led to an increase in storm and sewage run-off into our urban watersheds. The main fecal coliform bacteria present in water streams is the gramnegative Escherichia coli (E. coli ). While E. coli in our intestines does not cause much harm, the pathogenic strain of E. coli O157:H7 causes severe food-borne disease outbreaks in the United States [1].
According to the U.S. Environmental Protection Agency, 73% of rivers and streams and 23% of lakes and reservoirs have recreational use impairments like swimming, fishing, and boating [2]. Each year in the United States, E. coli infections cause approximately 265,000 illnesses and about 100 deaths [3]. The state of Indiana ranks first in the nation for water recreation impairments due to contaminated waterways. Over 24,000 miles of water streams are polluted and potentially dangerous for human bodily contact.
Several governmental water authorities and non-profit organizations routinely collect samples of urban waters weekly (or biweekly) to measure water quality parameters such as pH, dissolved oxygen, temperature, specific conductivity, and E. coli . These analytical methods are time consuming and only provide a retrospective analysis of E. coli loads. Forecasting of E. coli contamination in urban waters is necessary to provide real-time information to the public about their suitability for body contact, recreation, fishing, boating, and domestic utilization. Another caveat of the current methods is the lack of integration of the local climatic conditions such as changes in temperature and precipitation.
Hypothesis
E. coli contamination in urban waters can be forecasted based on routinely available climatic factors such as precipitation and temperature parameters.
Research question
Can data integration and analysis of local climatic factors such as temperature and precipitation using machine learning models provide real-time forecasting of E. coli contamination of urban waters?
Research goals
Identify key water and weather parameters which correlate to E. coli levels. 1) Identify threshold values of key input variables which predict E. coli bursts. 2) Identify seasonal variations in E. coli bursts. 3) Evaluate different machine learning models to forecast E. coli contamination in urban water streams.
Materials and Methods
Study area
Water sampling data was obtained from three watersheds located in Marion County (https://marionhealth.org/surface-water-program/). The Fall Creek watershed is located in central 4 Indiana. The stream begins in Pendelton, IN flowing towards downtown Indianapolis until merging with the White River. The watershed covers around 41.5 square miles of drainage area in Marion County [4]. Most of Fall Creek watershed is located in residential neighborhoods, roads, and commercial surfaces. The Pogue Creek Watershed is located in east Indianapolis, IN. The stream starts east of Indianapolis and empties into the White River. The watershed covers around 13 square miles of drainage tunnel area. Pogues Creeks runs underground through multiple urban developments including Lucas Oil Stadium. The State Ditch watershed is located in southwest Marion County. State Ditch sampling route includes sites within the lower White River Watershed. Detailed coordinates for the three watersheds are described on the Marion County watershed website (https://marionhealth.org/surfacewater- program/). Most of Fall Creek, Pogues Creek, and State Ditch watersheds are located in residential neighborhoods, roads, and commercial surfaces. Containments for these watersheds are established for E. coli and three other impairments. In addition, some recommended solutions to address the impairments include storm water controls, point source controls, manure management, and habitat improvements.
Dataset collection and analysis
E. coli contamination data was collected for three water streams from the Marion County, IN watershed project from 2003 to 2022. Daily temperature and precipitation data for Marion County were obtained from the National Oceanic and Atmospheric Administration site. As a first step in creating a unified dataset that includes all available parameters the weather and water data was combined using the date field as a common parameter (Figure 1).
Data cleaning
Most of the water sampling data used for data analysis was manually captured and had several discrepancies and data quality issues like typos, missing values, and duplicates values for different days of sampling. Data from excel was loaded into data frames and python code was used to remove nulls, hashes, spaces, non-numeric values (in lieu of expected numeric value) and duplicate entries.
Data normalization
Any data point that was higher than 3 standard deviation values was also removed to create a well-balanced dataset.
Exploratory data analysis
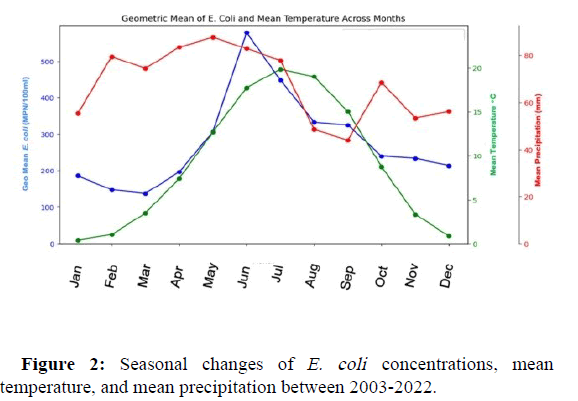
Several plots of input variable and E. coli levels were created as part of the initial data analysis to understand correlation between raw parameters in the dataset (input variables) and target variable of E. coli levels. It was conclusively evident that an insignificant correlation other than seasonal variation discussed previously in Figure 2 was identifiable.
Encoding categorical variables
As part of the one-hot encoding process for classification model data preparation, the EPA recommended threshold value of 235 MPN per 100 mL was used for encoding the target variable for further data analysis with multiple classification models.
Feature selection and extraction
As a next step, additional calculated values such as cumulative degree days, and max precipitation in 10 days or 15 days were computed and utilized for threshold calculation. These variables were also confirmed as critical for model prediction using the feature importance visualization of the XGBoost classifier model.
Training and comparing multiple models
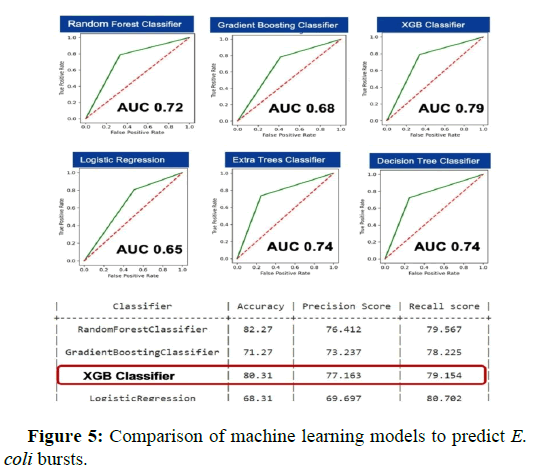
The final curated dataset of the selected variables was used with 6 machine learning models (Logistic Regression, Random Forest Classifier, Extra Trees Classifier, Decision Tree Classifier, Gradient boosting Classifier and XGB Classifier) to compare their performance. ROC and AUC metrics were used to determine that XGBoost was the best model to accurately classify data above or below safe levels for E. coli for human activity in water streams.
Results and Discussion
Seasonal changes in E. coli levels in urban streams
EPA recommends geometric mean as one of the computational parameters to monitor E. coli levels in water streams. Figure 2 showed a comparison plot of monthly E. coli levels with temperature and precipitation. The plot depicted elevated levels of E. coli which is considered unsafe for human activity during the summer and fall seasons, especially for the months of June and July. E. coli levels finally reduced to less than 235 MPN per 100 mL during spring and winter thus confirming the correlation to elevated temperature and E. coli levels.
Influence of temperature and precipitation thresholds on E. coli
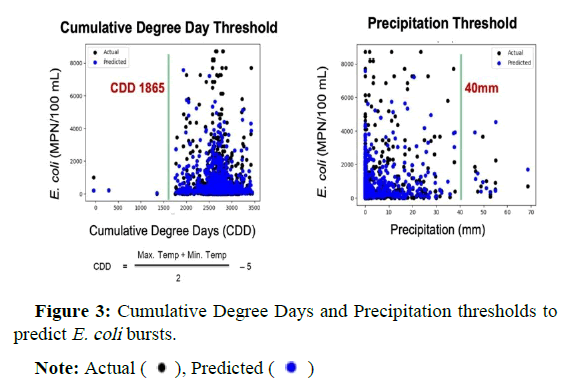
Previous studies had concluded that most of the water and weather parameters did not have a direct correlation to the changes in E. coli levels [5-9]. Farmer’s almanac consistently use Cumulative Degree Days (CDD) as a measure of heat accumulation over a period of time to 8 identify/predict ideal conditions for insect outbreaks to design measures for pest control (https:// entomology.ca.uky.edu/ef123). Since E. coli levels have seasonal variation, CDD calculation for a whole year would be a good indicator for predicting coliform levels. Using the CDD calculation formula outlined in Figure 3, average CDD was determined per day and CDD values for a whole year were computed.
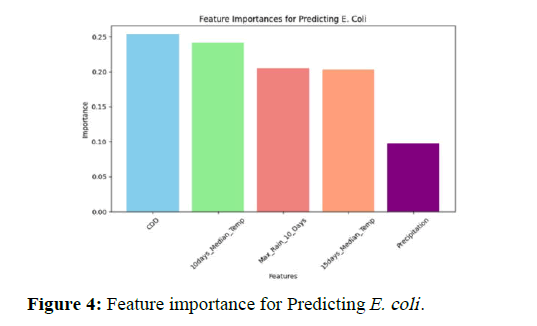
The following parameters were calculated for each year: CDD, median temperature in last 10 days, median temperature in last 15 days, max precipitation in last 10 days and max precipitation in last 15 days. Utilizing the XGBoost classification model, the actual and predicted values for E. coli were plotted in Figure 3. The data clearly indicated that 90% of the bursts happened when CDD was above 1865. This observation demonstrated that CDD was the critical parameter for predicting E. coli bursts. E. coli levels over 90% of predicted and actual values were also closely related to max precipitation in last 10 days below the threshold value of 40 mm, concluding that high levels of rainfall were not ideal for E. coli bursts since most of the bacteria maybe runoff to big water bodies.
Feature importance for predicting E. coli
Another key aspect in understanding the impact of input variables in model predictions especially for tree-based classifiers is a plot of feature importance graphs of all the variables in the descending order of relative importance. Feature importance plot serves as a useful tool for 9 interpreting machine learning models, identifying most important predictors, and gaining insights to decision pathway which helps to uncover underlying data relationships.
Figure 4 depicted that the CDD had the maximum impact followed by 10-day max temperature. Thus, the data presented in Figure 3 and 4 independently validated the importance of CDD to reliably forecast E. coli bursts in urban water streams.
Performance of machine learning models to predict E. coli bursts
Six machine learning models namely, logistic regression, random forest classifier, Extra trees classifier, XGBoost classifier, gradient boost classifier and decision tree classifier were utilized for further analysis with the goal of identifying the best model suited for predictions. ROC (Receiver Operating Characteristic) curve and AUC (Area Under the Curve) metrics were used to rank order the performance of these classification models. The ROC plot in Figure 5 showed a comparison of true positive rate (sensitivity or recall) over false positive rate (fall-out). All 6 models had an accuracy ranging from 0.65 (logistic regression) to 0.79 (XGB classifier). The XGBoost model with maximum AUC of 0.79 was the best model to distinguish between positive and negative instances of E. coli bursts above or below the threshold of 235 MPN per 100 mL.
High-performance XGb model predicts E. coli bursts in individual urban water streams
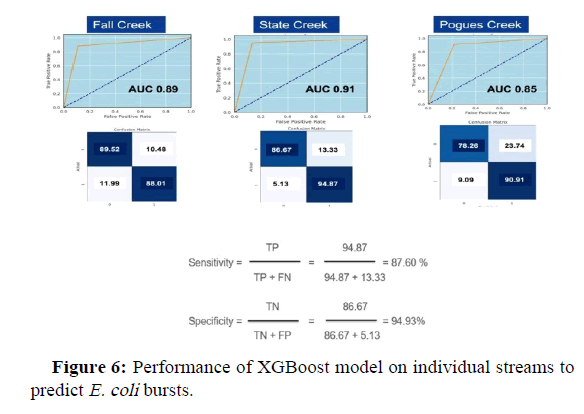
Training on smaller subsets reduces the risk of over fitting by providing less opportunity for the model to capture noise and random fluctuations in the data. The XGB Boost model was used to further analyze the subsets of data from each individual stream. The results in Figure 6 showed that the XGBoost model had high ROC values ranging from 0.85 to 0.91 to predict E. coli bursts. The additional benefit of this type of analysis would be to provide realtime alerts of E. coli bursts to the local population for the local water streams.
Conclusions
The main highlights of this study are as follows:
The XGB classification model performed the best over multiple individual streams of data with more than 89% accuracy in predictions. Over 20 different variables were used in the initial data analysis and feature importance determined the top 5 variables as model input.
Cumulative degree days CDD was utilized for the first time as a key parameter and consistently scored high on feature selection.
Machine learning models can successfully predict E. coli levels and prevent infections in humans.
The next steps of this research study include-Expand scope/data: Validate the model with more robust data. Other streams in Indiana/ other states. Include water streams from agricultural and farmlands. Identify variations in E. coli predictions across various climate types. A mobile app that can take everyday weather data and predict E. coli levels for a particular location in the USA.
References
- Saeedi P, Yazdanparast M, Behzadi E, Salmanian AH, Mousavi SL, et al. (2017) A review on strategies for decreasing E. coli O157: H7 risk in animals. Microb Pathog 103: 186-195.
- Saenz E (2022) Nearly three quarters of Indiana’s waterways are too polluted for safe recreation.
- A review on strategies for decreasing E. coli O157: H7 risk in animals
- Marion county public health department (2023) Fall creek report.
- Weller DL, Love TM, Wiedmann M (2021) Interpretability versus accuracy: A comparison of machine learning models built using different algorithms, performance measures, and features to predict E. coli levels in agricultural water. Front Artif Intell 4: 628441.
- Orr I, Mazari K, Shuke JT, Li R, Filippelli G (2023) The impact of combined sewer outflows on urban water quality: Spatio-temporal patterns of fecal coliform in Indianapolis. Environ Pollut 327: 121531.
- Chou JS, Ho CC, Hoang HS (2018) Determining quality of water in reservoir using machine learning. Ecol Inform 44: 57-75.
- Hannan A, Anmala J (2021) Classification and prediction of fecal coliform in stream waters using decision trees for upper green river watershed, Kentucky, USA. Water 13: 2790.
- Li R, Filippelli G, Wang L (2023) Precipitation and discharge changes drive increases in Escherichia coli concentrations in an urban stream. Sci Total Environ 886: 163892.
 Spanish
  Chinese
  Russian
  German
  French
  Japanese
  Portuguese
  Hindi
Hindi 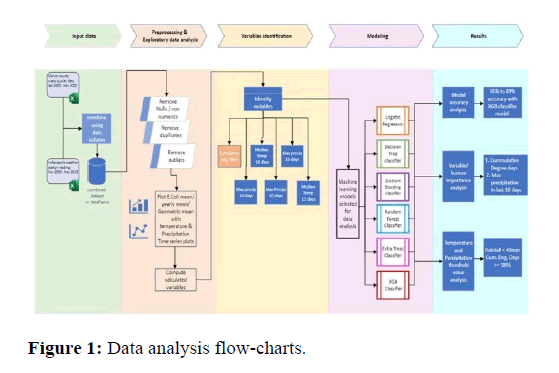
 ), Predicted (
 )
) 