Research Article, J Fashion Technol Textile Eng S Vol: 0 Issue: 3
Evaluation of Three-Dimensional Visual Perception of Garments
G Aydo├?┬?du1, S Ye├?┬?ilp├?┬▒nar2* and D Erdem2
1GNT Textile, T├?┬▒naztepe Mevkii Adatepe Mahallesi, Turkey
2Dokuz Eylül University, Engineering Faculty, Textile Engineering Department, T├?┬▒naztepe Campus, 35397, Buca/├?┬░zmir, Turkey
*Corresponding Author : Muzaffer Sevil Ye├?┬?ilpinar
GNT Textile, T├?┬▒naztepe Mevkii Adatepe Mahallesi 2/20 Sok No:29 Begos 3. Bölge, Buca/├?┬░zmir, Turkey
Tel: +90232-3017708–7708
E-mail: sevil.yesilpinar@deu.edu.tr
Received: September 20, 2017 Accepted: October 09, 2017 Published: October 13, 2017
Citation: Aydo├?┬?du G, Ye├?┬?ilp├?┬▒nar S, Erdem D (2017) Evaluation of Three-Dimensional Visual Perception of Garments. J Fashion Technol Textile Eng S3:001. doi:10.4172/2329-9568.S3-001
Abstract
In recent years, three-dimensional design, dressing and simulation programs came into prominence in the textile industry. By these programs, the need to produce clothing samples for every design in design process has eliminated. Clothing fit, design, pattern, fabric and accessory details and fabric drape features can be evaluated easily. Also, body size of three dimensional prototypes can be adjusted so more realistic simulations can be created. Moreover, three-dimensional virtual garment images created by these programs can be used while presenting the product to enduser instead of two-dimensional photograph images. In this study, a survey was carried out to investigate the visual perception of consumers. The survey was conducted for three different garment types, separately. Questions about gender, profession etc. was asked to the participants and expected them to compare real samples and artworks or three-dimensional virtual images of garments. When survey results were analyzed statistically, it is seen that demographic situation of participants does not affect visual perception and three-dimensional virtual garment images reflect the real sample characteristics better than artworks for each garment type. Also, it is reported that there is no perception difference depending on garment type between t-shirt, sweatshirt and tracksuit bottom.
Keywords: Garments; Textile industry; Fabric; Clothing
Introduction
In recent years, three-dimensional design, dressing and simulation programs came into prominence in the textile industry. These programs have some advantages both in terms of designers/factories and consumers. By these programs, the need to produce clothing samples for every design in design process has been eliminated. Clothing fit, design, pattern, fabric and accessory details and fabric drape features can be evaluated easily. Also, body size of three dimensional prtototypes can be adjusted so more realistic simulations can be created. All these features accelerate the design and decisionmaking process. Moreover, three-dimensional virtual garment images created by these programs can be used while presenting the product to end-user instead of two-dimensional photograph images [1-3].
In this study, a survey was carried out to investigate the visual perception of consumers. The survey was conducted for three different garment types separately. For the survey study, artworks, three-dimensional virtual garment images and real samples of the garments were created. It was expected from the participants to compare artworks, three-dimensional virtual garment images, and real samples. The answers of the participants were analyzed to understand if there is a difference in visual perception of individuals for the garment designs prepared by three different methods.
Materials
Artworks, three-dimensional virtual garment images and real samples of the same design were used to investigate the visual perception of individuals. Three different garment samples (t-shirt, sweatshirt and tracksuit bottom) were provided from the selected apparel company (Figure 1).
In addition to real garment samples, two-dimensional patterns which are created using Assyst CAD, artworks and fabric samples of garments were provided from the company. Artworks of t-shirt, sweatshirt and tracksuit bottom samples are presented in Figure 2.
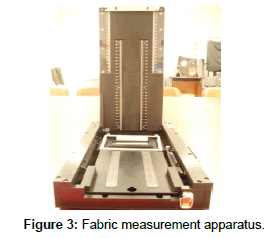
When three-dimensional virtual garments were preparing, physical properties of real garment samples’ fabrics were tested using Browzwear's fabric testing kit (Figure 3). Extension, shear and bend parameters can be investigated by this kit. Fabric specimens of three different garment types were prepared for tests. Each test was repeated three times. Each sample was conditioned under constant standard atmospheric conditions for 24 hours. The standard atmosphere for testing involves a temperature of 20 ± 2 degree C, and 65 ± 2% Rh. After the tests; average, standard deviation and coefficient of variation values of the samples were calculated and if coefficient of variation value is bigger than 10% tests were repeated. The values obtained from the measurements were entered into V-Stitcher three dimensional garment design software.
2D pattern files of real samples were transferred to Browzwear V-Stitcher program in Dokuz Eylül University Textile Engineering Department to prepare 3D patterns of virtual garments. Patterns of three different garment types were dressed up on three dimensional prtototypes, covered with garments and added model details to get a finished garment look in three dimensional garment design software. Physical properties of the garments of real samples were identified in the software before this process therefore when virtual garments were preparing any desired fabric was chosen. By this way, properties of the actual fabrics could be reflected on virtual garment during the simulation. Also, fabric properties as texture of fabrics, print details etc. were scanned with a high quality scanner and saved to software. Thus, three dimensional virtual garments were prepared closely similar to real samples. Figures 4 and 5 shows virtual woman and man mannequins dressed up in selected garments, respectively.
Method
In this study, a survey was conducted to evaluate the visual perception. In the first part of the survey, some questions about age, gender, the level of education, profession and online shopping tendencies were asked to participants to investigate their demographic situations and examine whether personality traits affect the visual perception or not. Then, in order to investigate the visual perception of consumers, five independent and twelve relevant questions were asked. Relevant questions were constituted to compare three-dimensional virtual garment images and artworks. Independent questions determined the situation if three-dimensional virtual garment image is preferred or not. To answer these questions, fivepoint Likert scale (1: Strongly disagree, 2: Disagree, 3: Partially agree, 4: Agree, 5: Strongly agree) was used. Relevant and independent questions were evaluated separately.
The survey was completed by 100 participants. Each participant answered the survey for each garment type separately. When the survey was applied to participants, real samples, three-dimensional virtual garment images and artworks of garments were shown and participants were expected to answer the questions. Entire survey was applied by face-to-face interviews. Survey results were evaluated using SPSS 15 statistical software. Significance level α was taken as 0.05 for these evaluations. Mann-Whitney U test and Wilcoxon W test were applied to survey findings.
Results and Discussion
In the first part of the survey, some questions were asked to participants to investigate their demographic situations. These questions are about age, gender, level of education, online shopping tendencies and profession. The sample of the survey consists of 100 participants. Age distribution of participants can be seen in Figure 6.
76% of participants took part between 21-27 age group. In the group of 24 % of participants, two participants took part within 17-20 age group, 22 participants took part in 28-55 age group.
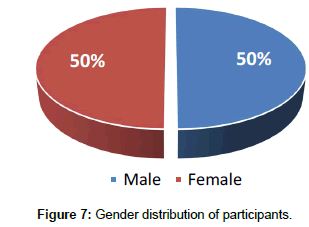
Figure 7 shows the gender distribution of participants. It is seen that half of participants were women and half of participants were men. Gender distribution is especially chosen as equal to investigate if visual perception changes by gender or not.
Level of education of participants is presented in Figure 8. It is seen that 3 participants were high school student or high school graduate, 45 participants were college student or bachelor and 52 participants were MSc/PhD or postgraduate.
Figure 9 shows the online shopping tendencies of participants. It is seen that 74% of participants were making their purchases online and 26% of them did not use internet for shopping.
Professions of participants were also examined. The aim of this question was to determine if participants have a job related to textile sector or not and to investigate if there is a visual perception difference between textile sector workers and the others. For this question, textile sector workers and textile students were considered in the same group. Results show that 53 participants were textile sector workers or textile students when other 47 participants were from different fields (Figure 10).
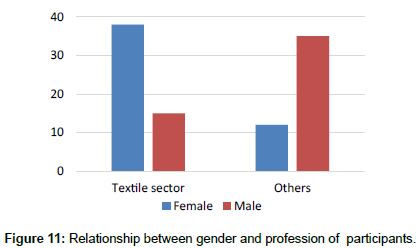
In addition to separate gender and profession datas, profession and gender relation of participants were also investigated (Figure 11). Out of 53 participants which have a profession related to textile sector, 38 participants were women and 15 participants were men. Out of 47 participants which have a profession not related to textile sector, 12 participants were women and 35 participants were men. In other words, women participants which have a profession related to textiles were 76% of the total population when this value was 24% for men participants.
In the second part of the survey, 5 independent questions to examine the preference situation of three dimensional virtual garment images and 12 relevant questions for comparison of three dimensional virtual garment images and artworks for each garment were asked to participants.
Figure 12 shows positive, negative and indecisive answers given to three dimensional virtual garment images and artworks for relevant questions. Wilcoxon test was carried out to perform a binary comparison of the three dimensional virtual garment images and artworks. The results indicated that three dimensional virtual garment images were preferred to artworks for each garment. Therefore, it can be said that three dimensional virtual garments reflected the real samples better than artworks.
Another issue which is examined in the survey questions is to understand if three dimensional virtual garment images or artworks reflected the color, texture and drape of the fabric used in real samples in a realistic way or not. When the results were analyzed, it was seen that most of the participants stated that three dimensional virtual garment images reflected the fabric color, texture and drape of the fabric more successfully. However, some participants found three dimensional virtual garment images and artworks equal (Figures 13-15). Only a small part of the participants reported that artworks reflected the fabric properties more realistic than three dimensional virtual garment images. With regard to these results, it can be said that three dimensional virtual garment images reflected the color, texture and drape of fabric in a more realistic way.
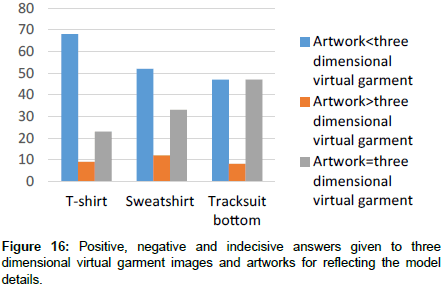
In another question, it was investigated if three dimensional virtual garment images or artworks reflected the model details (collar, arm, pocket, pleat, dart, hood etc.) of sewn sample in a realistic manner or not. When the responses were analyzed, it is understood that most of the participants found artworks more unsuccessful when compared to three dimensional virtual images (Figure 16). However, a considerable number of participants found these two images equal. This situation is especially significant for the answers given to tracksuit bottom. For instance, t-shirt is a basic garment type and it is easier to simulate it more realistically in V-Stitcher software. Nevertheless, it becomes complicated to simulate more detailed models in three dimensional software.
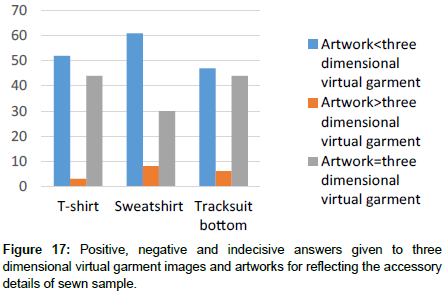
Another point examined in this survey was to investigate if three dimensional virtual garment images or artworks reflect the accessory details of sewn samples realistically or not (Figure 17). When Figure 17 was analyzed, it is seen that three dimensional virtual garment images reflected the accessory details better than artworks for each type of garment.
In the last part of the study, the effect of demographic structure (gender, online shopping tendencies and profession) on visual perception for each garment type was investigated using Wilcoxon W test. When p values were analyzed, it was seen that only a few questions remained under importance level. These results pointed out that demographic structure of participants made no difference on visual perception.
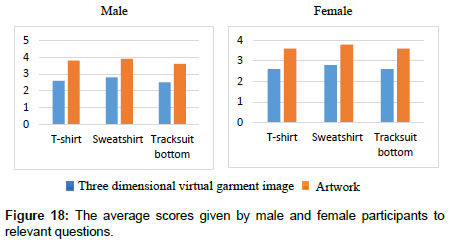
The average values of the scores given by the participants to relevant questions about three dimensional virtual garment images and artworks for each garment type were given in Figure 18. When results were analyzed it was seen that three dimensional virtual garment images was chosen to artworks. Average values of three dimensional virtual garments were over 3.5 when these values were about 2.5 for artworks over 5 for each garment type.
The effect of online shopping tendencies on visual perception was also examined. When people purchase their garments online they only see the pictures of them. However, some of the online shopping websites can provide to display front and back side of the garment, color options and zoom. In these conditions, even consumer cannot touch and try the garments, they can evaluate it virtually. One of the survey questions aimed to investigate the effect of such an experiment on visual perception. The average values of the scores for three dimensional virtual garments and artworks according to online shopping situations of participants were compared (Figure 19). Both groups preferred the three dimensional virtual images to artworks. When average and p probability values were examined for each garment, it was seen that online shopping tendencies does not affect the visual perception of consumers. Therefore, consumers could try on a garment with original fabric on a three dimensional prtototypes which has created according to their own sizes, see the details and fitting of the garment. When consumers purchase a garment by this way, contentment will increase and return and complaint rates will decrease.
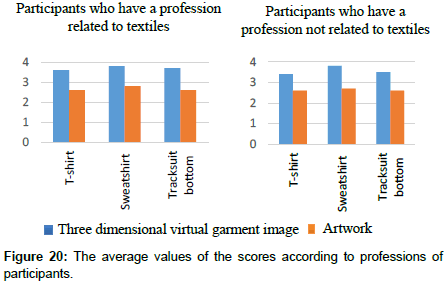
In another question, the effect of profession on visual perception was investigated. The scores of relevant questions about three dimensional virtual garments and artworks for each garment were evaluated. Figure 20 shows the average scores of relevant questions given by the participants who have a profession related to textiles and the other participants for each garment, respectively. Both groups prefer three dimensional virtual images to artworks. Average and p probability values indicated that profession has no effect on visual perception.
When average values of the answers of questions about three dimensional virtual garment images for each garment was investigated, it was seen that the smallest value was 2.86 and the biggest value was 4.29 over 5. When the same values for artworks were examined, it was seen that the smallest value was 1.88 and the biggest value was 3.24 over 5. Also, the answers about three dimensional virtual garment images were found to be concentrated in the options “strongly agree” and “agree” when this concentration was in the options “partially agree” and “disagree” for artworks. Additionally, average values of the answers were found to be similar for t-shirt, sweatshirt and tracksuit bottom. For instance, the average values of the answers for the question “I prefer three dimensional virtual garment images to photographs when I buy clothes” were investigated, it was seen that these values were 4.21, 4.25 and 4.08 over 5 for t-shirt, sweatshirt and tracksuit bottom, respectively. This situation was similar for other questions. These results showed that visual perception of consumers do not change according to different garment types.
Relationship between age and relevant questions which is asked to compare three dimensional virtual images and artworks was also investigated. The results of correlation analysis showed that age has no meaningful effect on relevant questions. Table 1 shows the correlation values of three dimensional virtual images and artworks for each garment. Correlation coefficient was measured on a standard scale and it can only range between -1.0 and +1.0. 0-0.49 means weak correlation, 0.5-0.79 means moderate correlation and 0.75-1.0 means strong correlation. As seen in the table, there is not a strong correlation between questions related age. This results indicated that age has no effect on visual perception.
| Relevant Questions | Correlations | |
|---|---|---|
| Three dimensional t-shirt | Pearson correlations Sig. (2-tailed) N |
0.031 0.756 100 |
| Artwork of t-shirt | Pearson correlations Sig. (2-tailed) N |
0.020 0.840 100 |
| Three dimensional sweatshirt | Pearson correlations Sig. (2-tailed) N |
0.100 0.321 100 |
| Artwork of sweatshirt | Pearson correlations Sig. (2-tailed) N |
-0.087 0.389 100 |
| Three dimensional tracksuit bottom | Pearson correlations Sig. (2-tailed) N |
0.112 0.268 100 |
| Artwork of tracksuit bottom | Pearson correlations Sig. (2-tailed) N |
-0.072 0.474 100 |
Table 1: Correlation between age and relevant questions.
When all independent and relevant questions were evaluated for each garment type, generally it was observed that threedimensional images of garments were liked more than artworks. It was concluded that three dimensional virtual garment images represented real samples better than artworks. Also, relevant and independent questions were evaluated according to demographic status of participants. When probability value of p was determined, it was observed that participants’ demographic structure didn’t make difference on visual perception to answer survey questions.
Conclusion
In this study, a survey was carried out using garment samples, their three dimensional virtual garment images and artworks to investigate the visual perception of consumers. Survey was conducted for three different garment types separately. In survey study, some questions about gender, profession etc. were asked to the participants and expected them to compare real samples and artworks or three dimensional virtual images with a certain number of questions. When survey results were analyzed statistically, it is seen that demographic situation of participants did not affect visual perception and three dimensional virtual garment images reflected the real sample characteristics better than artworks for each garment type. Also, it is reported that there was no perception difference depending on garment type between t-shirt, sweatshirt and tracksuit bottom.
Acknowledgments
We thank to Farbe Textile for assistance with clothing samples, patterns and artworks.
References
- Loker S, Ashdown S, Carnrite E (2008) Dress in Third Dimension: Online interactivity and its new Horizons. Clothing and Textile Research Journal 26: 164-176.
- Cordier F, Seo H, Magnenat Thalmann N (2003) Made to measure technologies for an online clothing store. Computer Graphics and Applications 23: 38-48.
- Bye E, McKinney E (2010) Fit analysis using live and 3D scan models. International Journal of Clothing Science and Technology 22: 88-100.
 Spanish
  Chinese
  Russian
  German
  French
  Japanese
  Portuguese
  Hindi
Hindi 

