Research Article, Geoinfor Geostat An Overview Vol: 12 Issue: 3
Estimation of Hypocentral Parameters of Local/Regional Earthquakes Using Grid Search Methods with A Fuzzy Logic Approach
Hüseyin Gökalp*
1Department of Geophysics, Karadeniz Technical University, Trabzon, Türkiye
*Corresponding Author: Hüseyin Gökalp,
Department of Geophysics, Karadeniz Technical University, Trabzon, Türkiye
E-mail: gokalp@ktu.edu.tr
Received date: 26 June, 2024, Manuscript No. GIGS-24-139859;
Editor assigned date: 28 June, 2024, PreQC No. GIGS-24-139859 (PQ);
Reviewed date: 12 July, 2024, QC No. GIGS-24-139859;
Revised date: 19 July, 2024, Manuscript No. GIGS-24-139859 (R);
Published date: 26 July, 2024, DOI: 10 .4172/2327-4581.1000392.
Citation: Gökalp H. Estimation of Hypocentral Parameters of Local/Regional Earthquakes Using Grid Search Methods with A Fuzzy Logic Approach. Geoinfor Geostat An Overview.12:4.
Abstract
This study presents improvements to the hypocentral method for identifying regional/local earthquake locations based on the grid search technique with a fuzzy logic approach. For this study, the newly proposed method was tested on synthetic models to evaluate its effectiveness in various situations. Subsequently, the method was tested on actual earthquake data. To investigate the effect of network shape on location identification, the technique was assessed using three artificial seismic networks with different station distribution geometries. Additionally, for all networks, three scenarios concerning the earthquake’s proximity to the networks were examined: Inside, just outside, and further away. Four types of norms were featured in this study: L2 and L1 for the P-wave and L2 and L1 for the S-wave. These four norms were transformed into fuzzy logic space using a half trapezoidal membership function that constructed minimum and maximum RMS values for all the norms. The location determination process was performed in two ways: Defuzzification of the output of the intersection process on four fuzzy logic output matrices and defuzzification of only grid points with maximum fuzzy output values.
The results show that this method of epicentral estimation is effective when an earthquake is shallow enough according to the distance between the event and the seismic network and has a special advantage when the location of an event is far from the network. This method is applicable only to the hypocentral location of an earthquake occurring in the upper crust, as only Pg and Sg arrivals on seismograms and a half-space velocity model are used; therefore, its validity is somewhat limited. However, by using this method, we were able to estimate the hypocenter locations of 151 shallow earthquakes that occurred in the eastern Black Sea and found that they closely resemble the locations identified by other seismic agencies. The average total difference between most earthquakes is approximately 5 km. This method appears to be highly effective for local earthquakes occurring within a network, for regional earthquakes occurring outside a network, and for hypocenter-station distances significantly greater than the distance between stations, that is, those with a great azimuthal gap.
Keywords: Earthquake location; Grid search method; Hypocenter; Fuzzy logic; Eastern black sea earthquakes
Introduction
In geophysics, determining the location of earthquake epicenters has been one of the longest-term problems. Obtaining reliable knowledge concerning the coordinates of seismic events and their origin times is important for analyzing tectonic processes in seismically and tectonically active regions and for more advanced seismological studies, such as for determining focal mechanisms, earthquake magnitudes, and stress conditions around hypocenters.
The inverse method first described by L.C. Geiger in 1912 formed the basis for the most commonly used algorithms for determining earthquake locations [1]. Several software applications applying the Geiger method to determine hypocenter coordinates and origin times have been developed, such as minimizing travel time residuals within a standard velocity model by iterative linearization steps starting from a trial solution; examples include HYPO71, HYPOINVERSE, FASThypo, HYPOELLIPSE, HYPOCENTER, and SEISMOS [2-7]. The observed travel time residuals and those calculated from a proper velocity model for the region of the first P-wave (and S-wave and even later phases) are minimized mostly in the least squares sense (L2 norm) and sometimes in the L1 norm. The double-difference method proposed by Waldhauser and Ellsworth minimizes the residuals for pairs of events recorded at common stations by altering the vector connecting the foci [8]. Similarly, Joint Hypocentral Determination (JHD) improves the relative locations of earthquakes and has been successfully applied for arrival times set from a seismic network with numerous stations [9]. Another basic relative locating technique is the master event method, in which travel time differences between a master event and other events at stations are used [10]. While these methods offer speed, the accuracy of hypocentral solutions for identifying earthquake locations has been observed to decrease due to uncertainties in observed arrival times, very large gaps in seismograph nets, and/or velocity models that often poorly represent real geological structures.
The grid search method is a direct method for locating earthquakes. Due to the limited computer capabilities in the late 1950s, this method was initially found to be too slow and impractical for identifying earthquake locations. Due to the increase in computer speed, the grid search method became more practical at the start of the 2000s. Thereafter, grid search algorithms became useful tools for seismologists to locate seismic events [11-13]. The forward simplex search software developed by Lee and Dodge was designed to minimize the L1 norm (rather than the L2 norm in the least squares sense) when searching for earthquake locations [14,15]. Gökalp has recently investigated the effectiveness of these methods under various circumstances. In the case of lower quality recorded seismic phases, a poorly constrained velocity model, or a very large gap in a seismic network, a fuzzy logic approach has been used to avoid problems that may occur using the inverse method [16,17].
In this study, which aims to increase the accuracy of earthquake location, the grid search method was combined with a fuzzy logic algorithm to estimate the hypocentral parameters of regional earthquakes. Both the L1 and L2 norms were utilized and calculated for P-wave and S-wave arrival times, resulting in four matrices. These matrices were mapped into the fuzzy logic space using proper trapezoidal membership functions constructed for each matrix. The locations of the earthquake hypocenters were evaluated in fuzzy logic space. The logical processes of union and intersection, as well as possible combinations of fuzzy set data and their effects on the determination of the hypocenter of events, were also considered. The final hypocentral locations for the hypothetical and real earthquakes were derived using the gravity of center method during defuzzification.
To test this new earthquake location method on real data, a number of earthquakes, which occurred mostly on the Black Sea coast and in northeastern Anatolia, were selected as case studies. These earthquakes were recorded by regional stations belonging to the Turkish National Seismic Networks, including the earthquake department in the Disaster and Emergency Management Presidency (Ankara, Türkiye; AFAD) and the network of the Kandilli Observatory and Earthquake Research Institute (Istanbul, Türkiye; ISK) [18]. The real data used in the location procedure consisted of the arrival times of P-waves and S-waves in the near-field phase from selected earthquakes that occurred in the black sea region and northeastern part of Türkiye. To evaluate the ï¬t of the two methods and discuss improvements in the quality of the data, the locations of the earthquakes were calculated using a grid search method with a fuzzy logic approach, and then those calculations were compared with the results obtained from seismological centers using a conventional inversion method.
Methodology
Fuzzy logic
Lotfi Zadeh was the first to introduce fuzzy set theory, publishing an article that emphasized the mathematics of the theory and fuzzy logic [19]. Fuzzy logic theory involves both fuzzy sets and fuzzy measurement theory. In fuzzy set theory, elements are assigned a value of either 0 or 1, which is equivalent to true or false. In fuzzy sets, elements are assigned values between 0 and 1. A value of 1 signifies complete membership, while a value of 0 signifies incomplete nonmembership. Intermediate degrees of membership are represented by values between 0 and 1. The membership function is responsible for mapping elements to these values. The membership function, denoted by μA (x) for a fuzzy set A, maps the elements of the universal X into a numerical value within the range (0–1), that is,

The value μA (x) can be considered a possibility, that is, similar to the probability that A belongs to the set X, if it has the value x. The set X defined for μA (x) >0 is called a fuzzy set.
The membership function for the union of two sets, A and B, is defined as follows:

The intersection of two sets, A and B, has a membership function that is given by the following formula:

The four primary components of a fuzzy logic system are fuzzy logic, rules, an inference engine, and a defuzzifier. This process is referred to as nonlinear mapping of an input dataset to scalar output data [20]. The fuzzification process begins by gathering a clear set of input data and then transforming it into a fuzzy set with fuzzy linguistic variables, fuzzy linguistic terms, and membership functions. Following that, an inference process is undertaken, following a specific set of rules. The final step is defuzzification, whereby the fuzzy output is transformed into a crisp output by utilizing membership functions (Mendel, 1995). The defuzzing process is based on the membership function of the output variable. The most frequently employed defuzzification algorithms are the center of gravity, center of area, center of gravity for singletons, rightmost maximum, and leftmost maximum (IEC a, b). Further information on this subject can be found in Kandel, Zimmermann, Yager & Zadeh, Jamshidi, Marks, Mendel, and IEC (1997a, b) [21-27].
Adaptation of the grid-search location method with fuzzy logic
The calculated arrival time eq at station i can be written as follows:

where  is the calculated travel time as a function of the known station location (xi, yi, zi), the accepted hypocenter location (x0, y0, z0), the assumed velocity model, and the origin time t0. The residual ri for station i is defined as the difference between the observed and calculated travel times:

where  is the observed arrival time. The synthetic travel time eq from a point (x, y, z) to a station (xi, yi, zi) can be calculated assuming that all stations have no altitude:

where v is the velocity (Vp for the P-wave and Vs for the S-wave). For a gridded model, calculating the travel times to any point is simple, as a grid search can be performed for all the grid nodes. Therefore, there will be n equations for each point in the model:

As the travel times can be synthetically calculated for the model, the unknown parameter t0 must be estimated by applying an averaging process or using a Wadati diagram considering all the observations.

where  P is the arrival time at a station and
  is the difference between the S arrival time and the P arrival time. The following equation allows calculation of the origin time:

Where  For the number of stations, n, the origin time, t0, can be attained in an average sense using the following formula:

The most commonly used method for locating earthquakes is to find the minimum of the root of the average residual (RMS) squared by minimizing the L2 norm in the least squares solution, as follows:

When the data contain large outliers, the L1 norm must be minimized, which means finding the minimum values of the sums of the absolute residuals, as a norm for the misfit is considered more robust [28].

After the RMS is calculated for all grid points, the solution is reached by assigning the point with the lowest RMS value. The simplest way to indicate the uncertainty of the location is to contour the RMS of the residuals as a function of x and y (in the twodimensional case). Routine location programs often use the RMS as a guiding parameter for determining location accuracy. However, the RMS is only a sign of data fit, and a low RMS does not always indicate that a correct solution has been obtained. While the grid search method is much slower than iterative location methods are, a variation called the “directed random walk” Lomax et al., is slightly less time consuming. A directed random walk does not require searching for the whole volume of x, y, or z [29,30].
Concerning the location of regional earthquakes, seismic network records generally involve considerable uncertainties in both the arrival times and the velocity model used in the location process. When variations in velocity structure along ray paths are excluded and the fixed ranges of uncertainty are assigned to the phase arrival times, the locations of the events are often erroneous. In this study, uncertainties in both arrival times and therefore RMS values were mapped into fuzzy logic space using an associated fuzzy logic model (i.e., membership functions in the logic space) for both P-wave and S-wave data to account for uncertainties in wave velocities. The hypocentral locations of the regional and local earthquakes examined were then evaluated in fuzzy logic space. As two types (the L1 norm and L2 norm) of RMS were calculated for both P-wave and S-wave arrival times, four types of logical matrices were used to obtain the optimal solution to enhance the reliability of the tests of the location method proposed in this article.
The following logical operations were used first to evaluate the location of an event in the logic space:

Where PL2 and SL2 correspond to L2 norms of RMS for both the P-wave and S-wave, respectively. Similarly, PL1 and SL1 correspond to the L1 norms of the RMS for both the P-wave and S-wave. Then, the following logical operation was considered:

Due to some logical combinations applied to synthetic models, the most preferred model in real life is as follows:

Applying the location procedure to synthetic models
In this study, a forward modeling technique (i.e., direct method) was applied. The uncertainties in arrival times, which, in an inverse method, are generally caused by an incorrect earthquake location, were transformed into uncertainties in RMS values
First, the efficiency of the method in determining epicenter locations and then hypocenter locations was investigated. Furthermore, to understand why the success of the method varies across networks with different geometries, three different seismological networks were utilized in the implementation. Figure 1 shows three types of seismological network configurations used in synthetic models for investigating how the shape or configuration of the seismic network affects the understanding of a regional earthquake location: Network 1, which is a common network (upper); Network 2, which is the Yellowknife Seismological Network for investigating the feasibility of teleseismic detection and identification of nuclear explosions; and Network 3, which consists of a combination of all stations in a regional network and a small number of stations in the national network [29,31].

Figure 1: Three artificial seismic networks used in location processing.
The method was first implemented on Network 1, with the exception of an earthquake that occurred at a known location with x=0 km, y=0 km, and z=0 km. The study area was divided into a matrix of 401 cells, which measured 1 km on each side. Each cell was used as a trial epicenter. To calculate the travel time, a homogeneous half-space model with a P-wave velocity of 6.0 km/s and an S-wave velocity of 3.46 km/s was used. Generally, a half trapezoidal membership function was applied to map uncertainties in calculated RMS times into fuzzy logic space (Figure 2). The maximum and minimum RMS values were utilized for construction of the membership function. Assuming that the grid node with the minimum RMS value represents the earthquake location, the minimum value was assigned to the upper right corner of the half trapezoidal function, and the maximum RMS value was assigned to the bottom right corner. Based on both synthetic models and real earthquake cases, more plausible and suitable results were obtained when the upper left corner of the half trapezoid took the minimum value of RMS and the upper right corner of the half trapezoid had the main value of RMS, plus an amount of (e.g., 10%-20%) of this value. In another world, the half trapezoid membership function becomes a half triangle when there is no noise because the minimum RMS value is zero.

Figure 2: The fuzzy logic models for mapping the Root Mean Square (RMS) values into the fuzzy logic space. (a) for the norm of L2 data; (b) for the norm of L1 data.
Figure 2 shows the membership functions for PL2 (a) and PL1 (b), which are, for example, necessary for transforming or mapping the uncertainties in the RMS values into fuzzy logic space. Similarly, two membership functions for SL2 and SL1 not depicted here were constructed using a higher percentage for the upper left corner of the half trapezoid because S-wave onsets have more uncertainties than P-wave data and were used together with the other two in the fuzzification process.
Figure 3 shows the fuzzy outputs of PL2 (a), SL2 (b), PL1 (c), and SL1 (d) and the results of the fuzzy logic process on all the fuzzy outputs of the RMS values, obtained by applying equation (15) for an earthquake that occurred at the center of the seismic network located at a known position, where x=0 km, y=0 km, and z=0 km (Figure 3). The yellow stars show the epicenter, which was accurately estimated, as depicted in Figure 3.
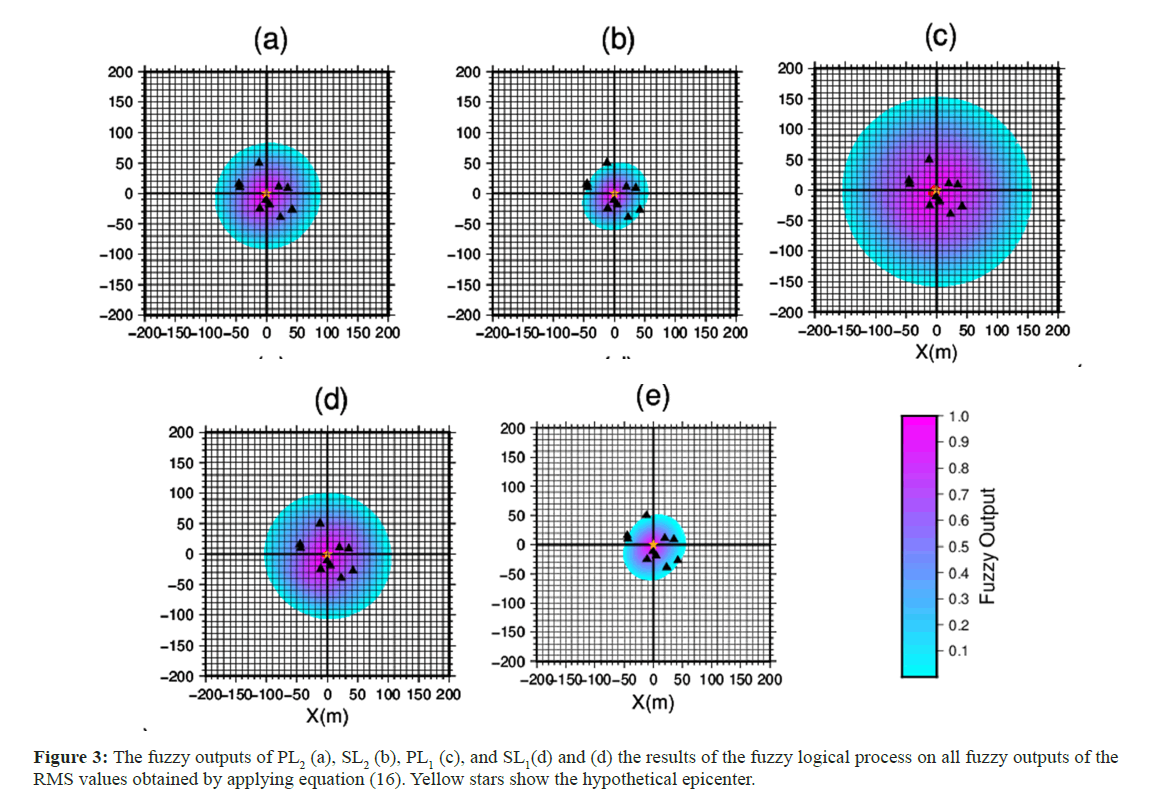
Figure 3: The fuzzy outputs of PL2 (a), SL2 (b), PL1 (c), and SL1(d) and (d) the results of the fuzzy logical process on all fuzzy outputs of the RMS values obtained by applying equation (16). Yellow stars show the hypothetical epicenter.
The value of the upper right corner of the membership function in the half trapezoid was 10 for both PL2 and SL2 and 20 for both PL1 and SL1. The value of the upper left corner of the membership function was 0.5 for both PL2 and SL2 and 1 for both PL1 and SL1 (Figure 3). SL2 dominates the solution because it has the narrowest membership function (i.e., a half triangle), as shown in Figure 3.
Normally, RMS values in L2 norms in S-wave data are much greater than those in P-wave data, and RMS values in L1 norms are in turn generally greater than those in L2. Therefore, because the same membership functions are used for both PL2 and SL2, based on Figure 3, SL2 seems to dominate the solution. The defuzzification process of the fuzzy outputs of the RMS was performed to reliably obtain the epicenter location of the hypothetical earthquake, as shown in Figure 3. Even when utilizing equation (14), the epicenter location was obtained successfully; however, in this case, PL1 was dominant in the solution instead of SL2.
Figure 4 shows the fuzzy outputs of the RMS values for hypothetical earthquakes occurring at three different locations in the three types of seismic networks based on the results obtained by the fuzzy logic process utilizing equation (15). In Figure 4, the columns in Figures a-c show the obtained results for the three types of station networks. The upper subfigures, medial subfigures, and lower subfigures, respectively denote the fuzzy outputs of the results for the earthquakes in different locations, which were at x=0 km, y=0 km, and z=0 km; x=50 km, y=50 km, and z=0 km; and x=100 km, y=100 km, and z=0 km. The yellow stars in Figure 4 are the epicenters of the earthquakes that were perfectly determined by this method. As shown in Figure 4, when an earthquake occurs inside the network, the fuzzy outputs have a circular shape, as we expected; when an event occurs both inside and outside the network, the fuzzy outputs have a crescent shape. The synthetic data do not contain errors or noise, as the ideal data were utilized in the process.
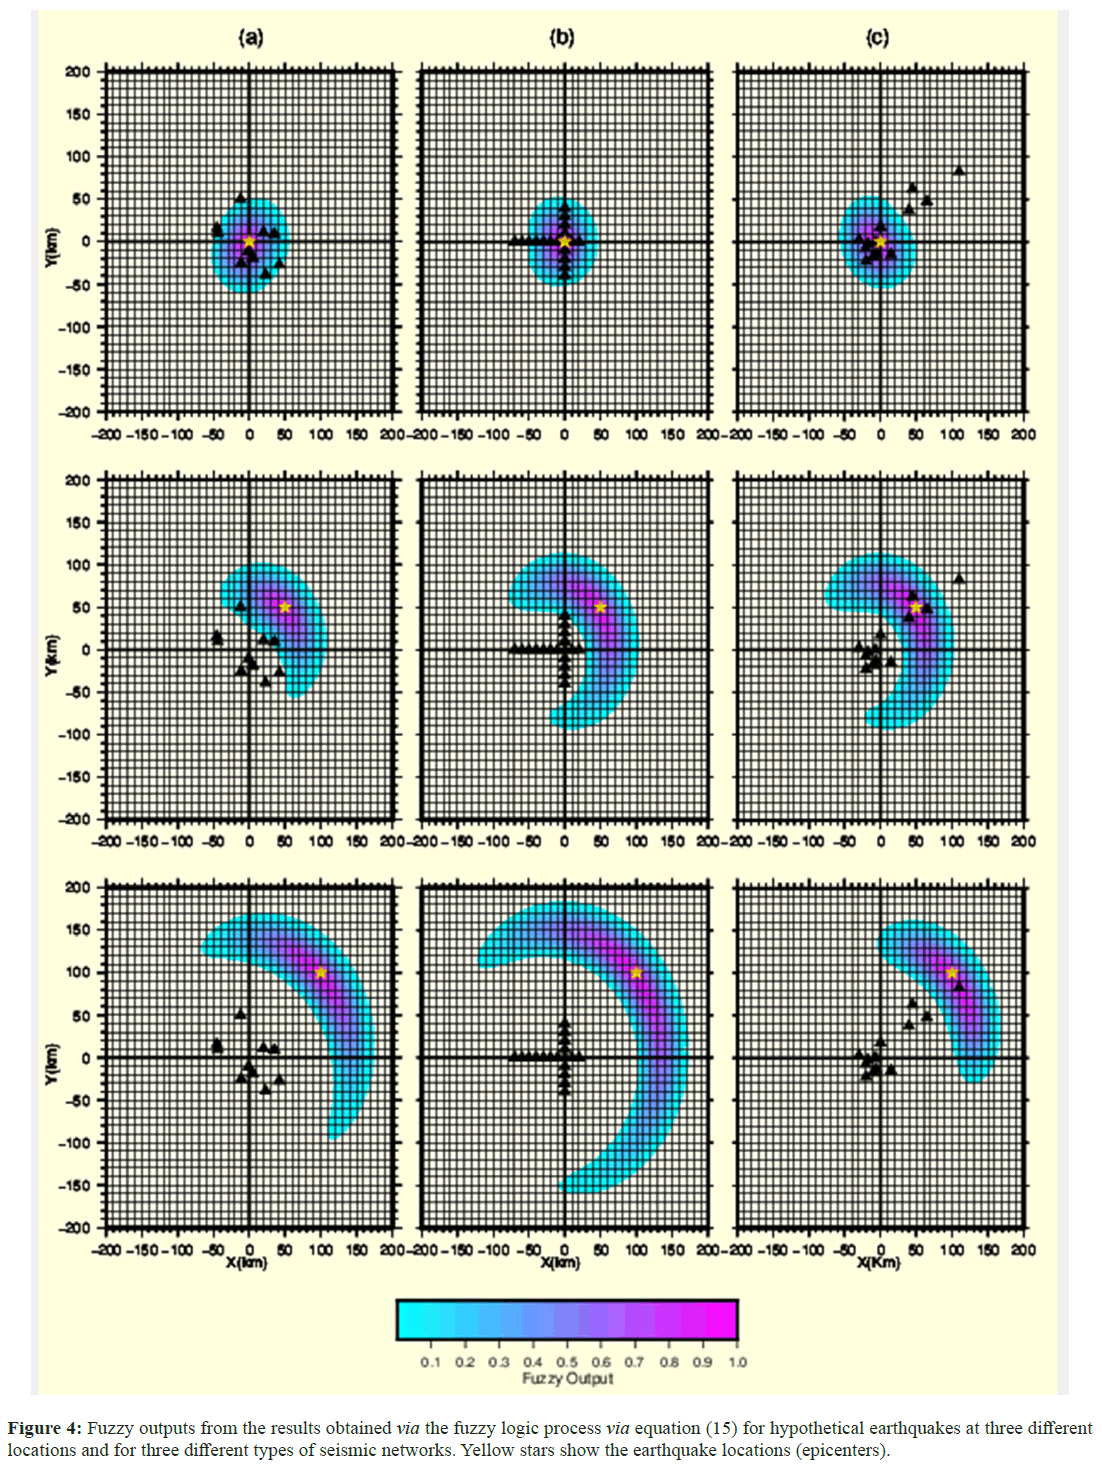
Figure 4: Fuzzy outputs from the results obtained via the fuzzy logic process via equation (15) for hypothetical earthquakes at three different locations and for three different types of seismic networks. Yellow stars show the earthquake locations (epicenters).
Table 1 shows the actual and estimated earthquake epicenters (h=0 km for all events) as well as the maximum and minimum RMS values obtained for all grid points in each estimation process. Table 1 demonstrates that this method was successful in determining the epicenters. Upon examining the maximum RMS values obtained for each network solution, it is apparent that Network 1 had the lowest values, while Network 3 had the highest. A possible reason for this result may be that the stations in Network 3 were more dispersed than were the other two station networks, considering the event locations compared to the station spaces in the network.
0000000.003410.94784545045.04844.72500.00137.922545457070070.07469.68900.000812.762870.08869.823100100099.93399.97700.002419.2419100100Netwok-2
2501.78574.8100.020925.5251254945048.80545.13800.047717.240348.80545.1387380072.73680.12200.047515.911972.73680.12299105098.945104.8600.000521.695798.945104.86Network-3
76206.956561.91300.039227.32966.956561.91315750157500.00725.717620800208000.004524.637525900259000.002722.9113
Table 1: Comparison of the real earthquake coordinates (i.e., epicenters) and those estimated by this method and the calculated extreme RMS values for three different seismic networks under ideal conditions.
This approach is also valid for Network 3, where the events were located far from the network. In Network 3, the stations in the center are closer to the event locations, which likely causes the earthquake location to be estimated with greater error than in the other networks (Table 1).
Figure 5 shows the fuzzy outputs and epicenter estimates for hypothetical earthquakes with different epicenter locations and a fixed focal depth of h=30 km. Table 2 lists the actual and estimated epicenter locations at different positions with a constant focal depth, and two estimation processes are shown. While the first process, labeled earthquake coordinates I, followed the current method, the other was obtained by defuzzing the sum of four fuzzy outputs (earthquake coordinates II) in Table 2.
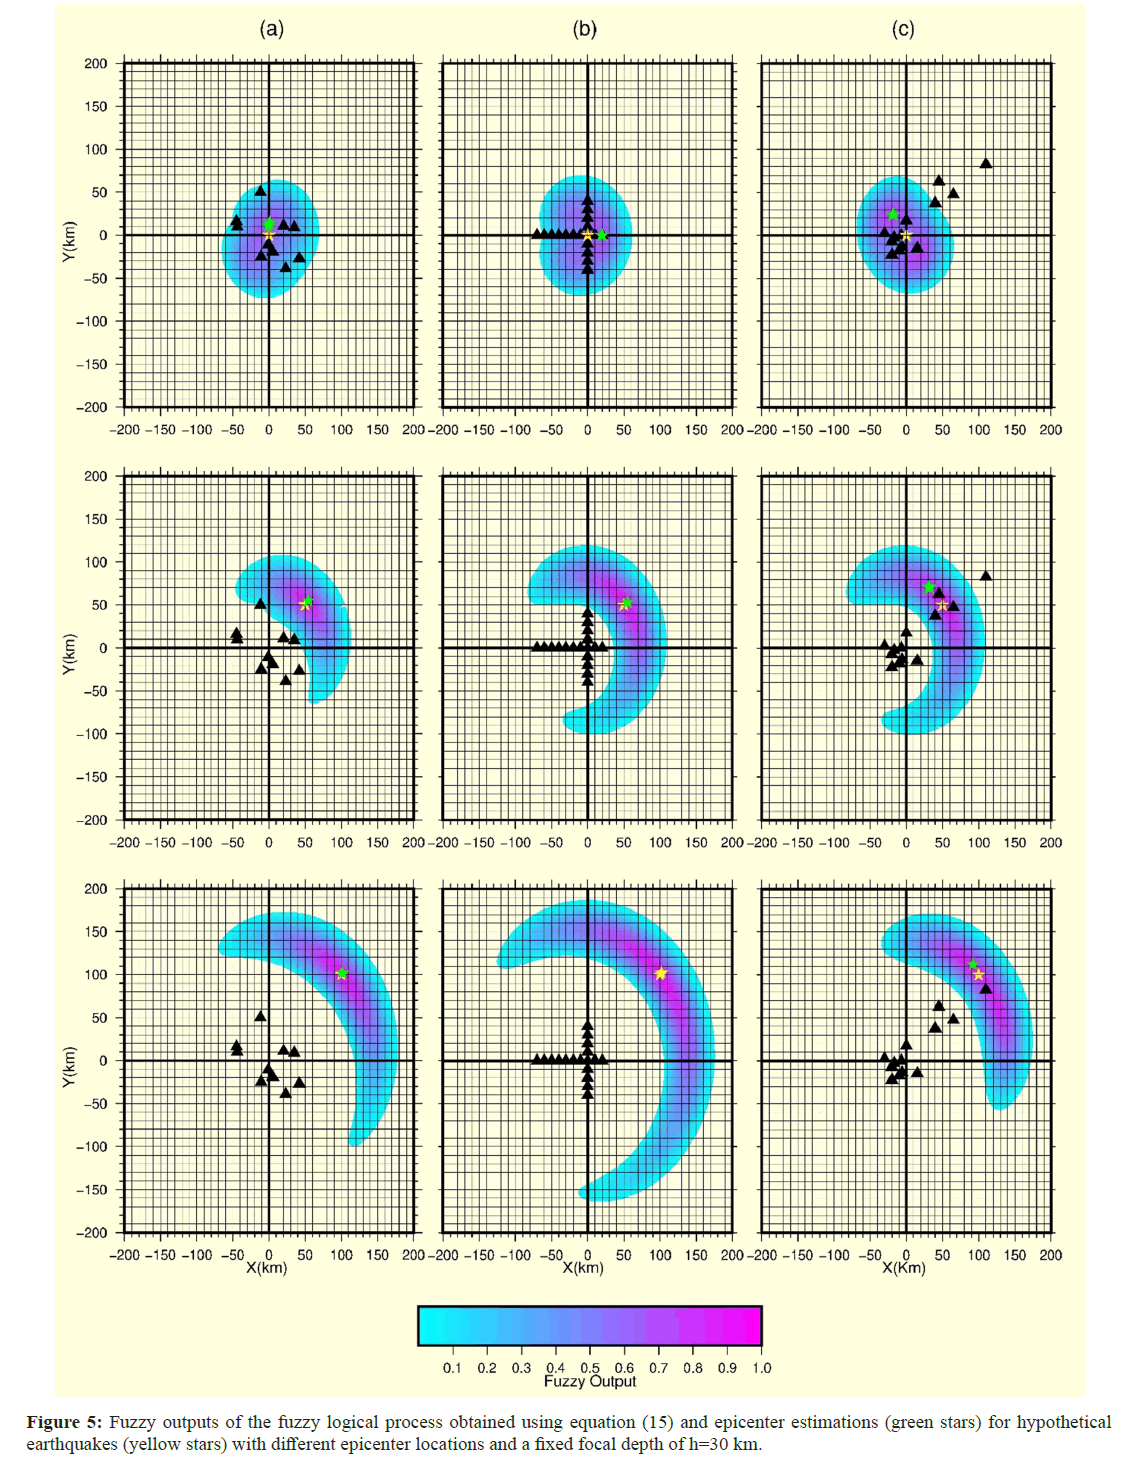
Figure 5: Fuzzy outputs of the fuzzy logical process obtained using equation (15) and epicenter estimations (green stars) for hypothetical earthquakes (yellow stars) with different epicenter locations and a fixed focal depth of h=30 km.
Table 2: Comparison of real earthquake coordinates (i.e., epicenters) and estimated coordinates using this method and calculation of extreme RMS values for three different seismic networks under ideal conditions.
The two calculations yielded identical results. A remarkable feature of Network 1 and Network 2 is shown in Figure 5 and Table 2, which demonstrate that smaller differences between the actual and estimated values obtained (the difference approaches 0) were associated with earthquakes occurring further from the seismic network. When the earthquake was just outside the seismic network, the estimates for Network 1 and Network 2 were very similar, and the errors in the location process were the same. When the earthquakes were further outside the network, the estimations for Network 1 and Network 2 were even more similar to each other, while the error numbers for Network 3 were slightly greater. On the other hand, the most successful of the three different predictions for Network 3 was that of the last case, when the event was located far from the network (Table 2).
The last analysis focused on cases where the in situ velocity and origin time were incorrectly determined f or hypothetical earthquakes, most likely in previous studies, and the arrival time data contained noise. To test this method for identifying earthquake locations in realistic scenarios, random noise uniformly distributed over +3% of the data was added; Vp=5.8 km/s was adopted instead of the real value (6 km/s); and the focal depth was chosen as h=30 km instead of 0 km. Figure 6 shows the obtained results in an erroneous situation. The green stars show the estimated epicenters, while the yellow stars represent the actual epicenters.
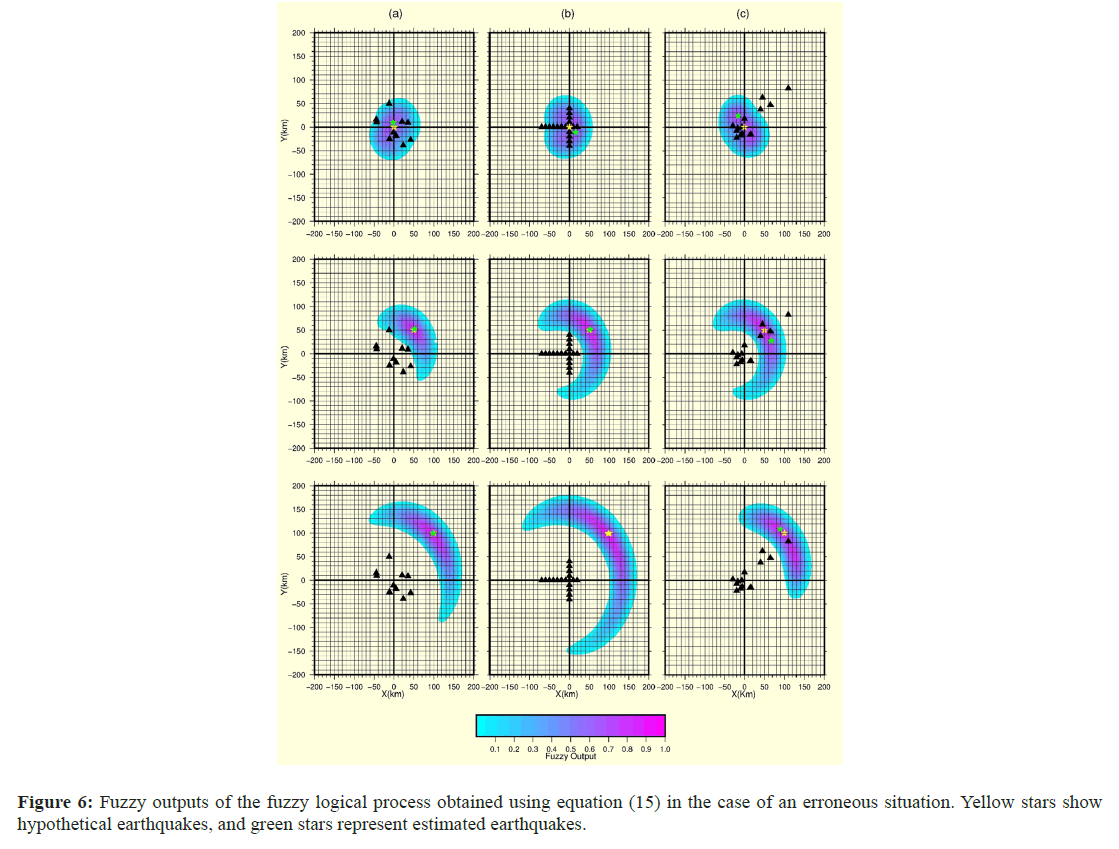
Figure 6: Fuzzy outputs of the fuzzy logical process obtained using equation (15) in the case of an erroneous situation. Yellow stars show hypothetical earthquakes, and green stars represent estimated earthquakes.
Table 3 provides an improved understanding of the method’s capabilities by showing actual and estimated epicenters located at different locations with different focal depths. Based on visual investigations of both Figure 6 and Table 3, it is clear that whenever a seismic event occurs far from the network, the identified location is closer to the actual location; therefore, this method is a suitable candidate for locating an earthquake when the epicentral distance is much greater than the distance between stations in a network. The solutions obtained are similar to those shown in Figure 5, and the uncertainties in velocity and origin times do not affect the hypocenter estimation as expected. This is probably because the location of an earthquake at a certain focal depth rather than at a shallow depth is estimated with noisy data (Table 3).
Table 3: Estimations of the epicenters for hypothetical earthquakes that would occur at different locations in three seismic networks under nonideal conditions.
In conclusion, the further an earthquake occurs from a network, the more successful this method is at estimating the location. Before undertaking the location process, to represent the actual earthquake location methods, the travel times are calculated, and arrival times are obtained by adding origin times. Next, according to expression (11), the origin time is calculated and subtracted from the arrival times to obtain travel times and the related RMS values.
Identifying the location of seismic events using the 3D fuzzy logic approach requires both epicentral parameters and hypocentral depth. In this case, for Network 1, the study area was represented by a 3D grid net with a matrix of 200 × 200 cells of 1 km on each side and 30 layers with 1 km increments.
All calculations performed for estimation of the epicenter, as explained above, were repeated in 3D. Figures 7-10 show the fuzzy outputs of PL2, SL2, PL1, and SL1, respectively, as 3D perspective views for an earthquake that occurred at a known position of x=0, y=0, and z=10 km. The epicenter is shown by a yellow star, and the hypocenter is denoted by a red circle. There are similarities in all the fuzzy outputs in the figures, and the maximum fuzzy output values are located within and within the vicinity of the hypocenter. Figure 11 shows the results of the fuzzy logical process on all the fuzzy outputs of the RMS values, applying equation (15) in a half-egg shape. Yellow stars depict the locations of both the epicenter and hypocenter.
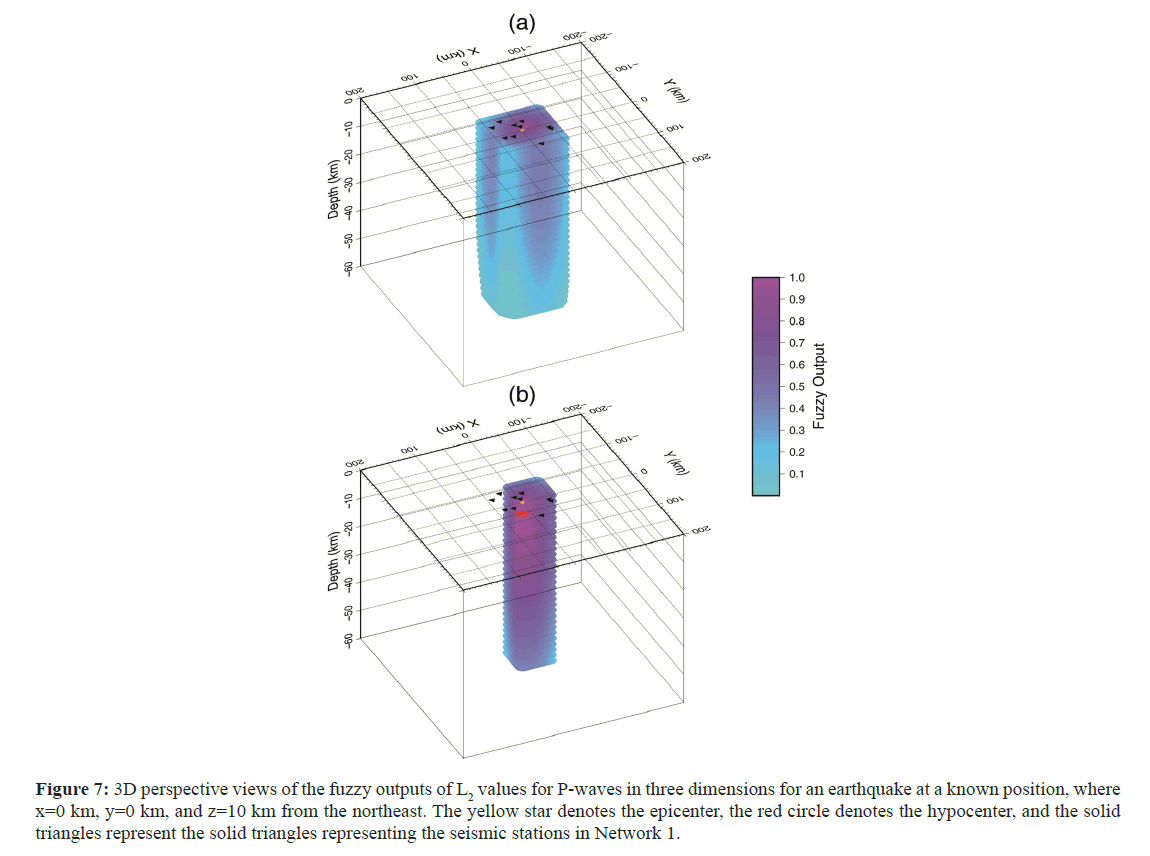
Figure 7: 3D perspective views of the fuzzy outputs of L2 values for P-waves in three dimensions for an earthquake at a known position, where x=0 km, y=0 km, and z=10 km from the northeast. The yellow star denotes the epicenter, the red circle denotes the hypocenter, and the solid triangles represent the solid triangles representing the seismic stations in Network 1.
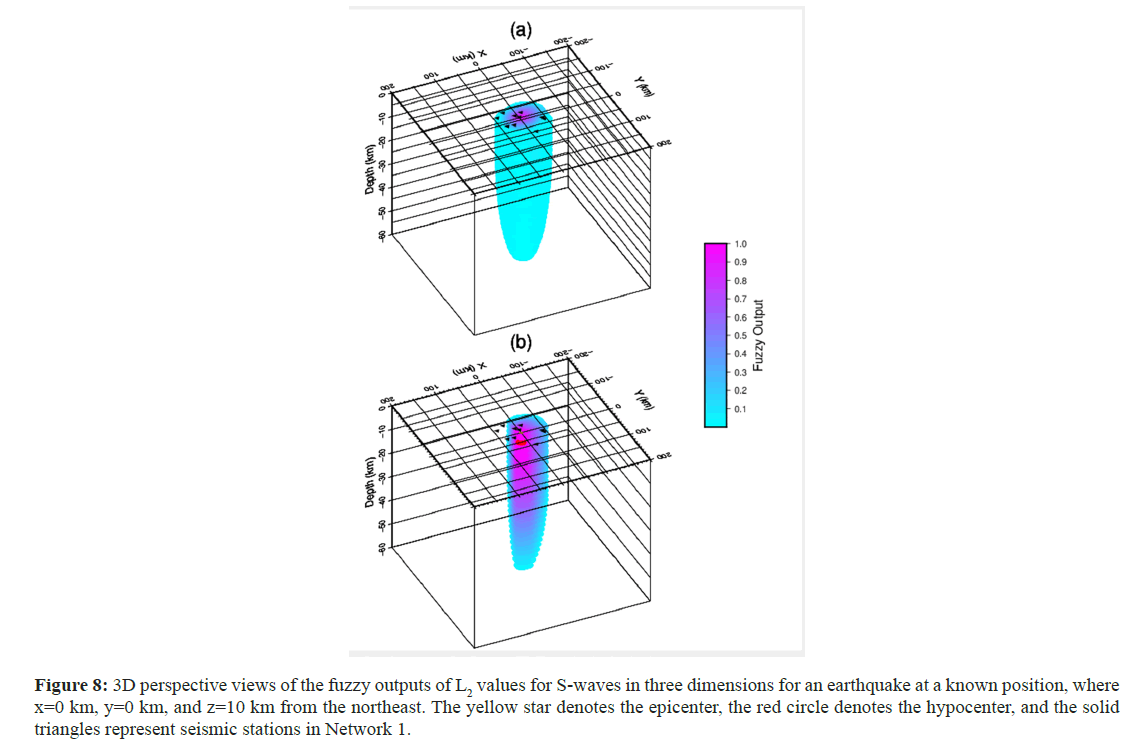
Figure 8: 3D perspective views of the fuzzy outputs of L2 values for S-waves in three dimensions for an earthquake at a known position, where x=0 km, y=0 km, and z=10 km from the northeast. The yellow star denotes the epicenter, the red circle denotes the hypocenter, and the solid triangles represent seismic stations in Network 1.
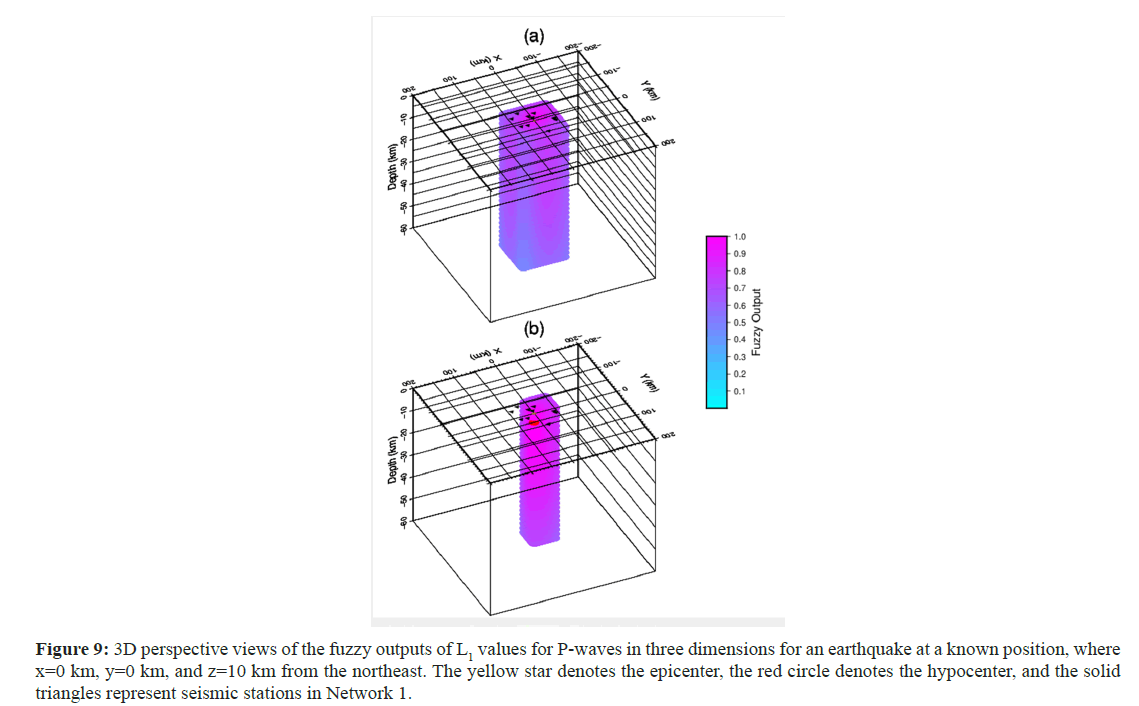
Figure 9: 3D perspective views of the fuzzy outputs of L1 values for P-waves in three dimensions for an earthquake at a known position, where x=0 km, y=0 km, and z=10 km from the northeast. The yellow star denotes the epicenter, the red circle denotes the hypocenter, and the solid triangles represent seismic stations in Network 1.
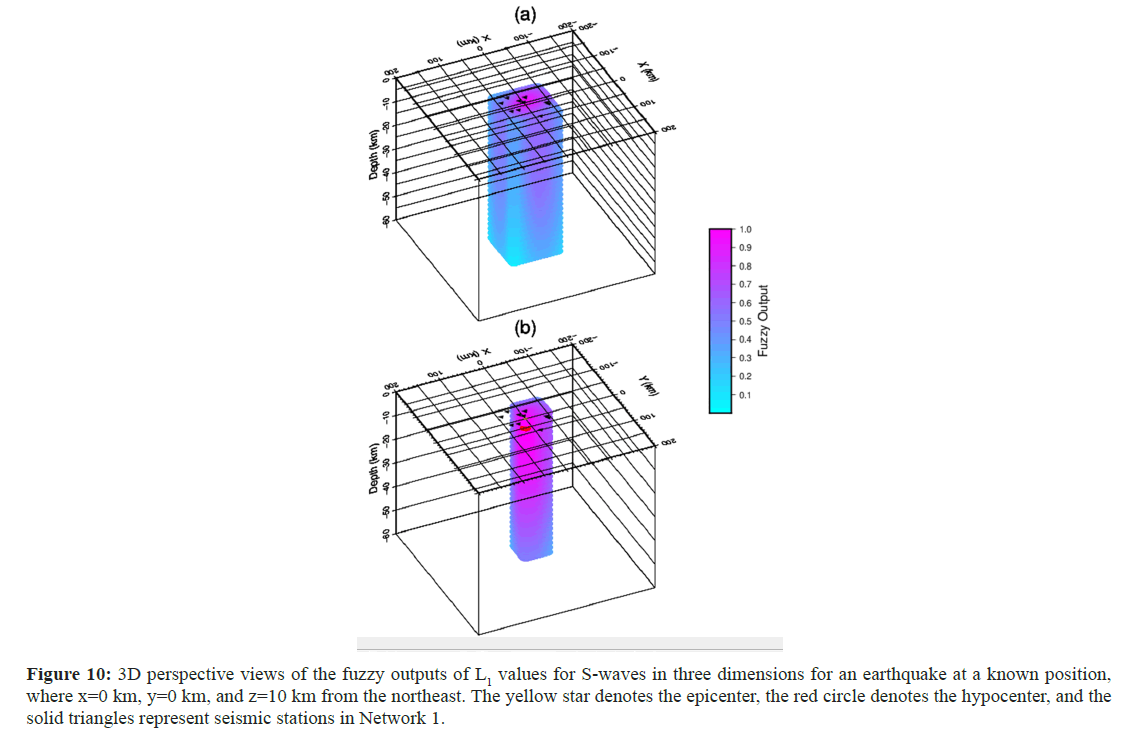
Figure 10: 3D perspective views of the fuzzy outputs of L1 values for S-waves in three dimensions for an earthquake at a known position, where x=0 km, y=0 km, and z=10 km from the northeast. The yellow star denotes the epicenter, the red circle denotes the hypocenter, and the solid triangles represent seismic stations in Network 1.
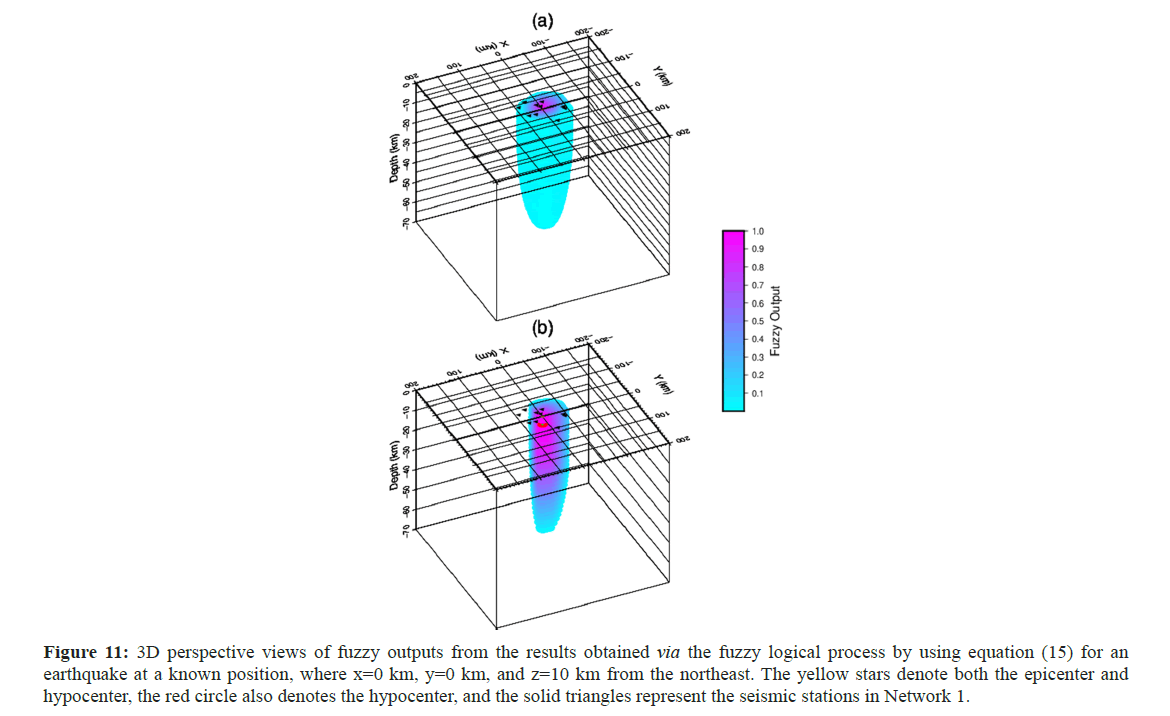
Figure 11: 3D perspective views of fuzzy outputs from the results obtained via the fuzzy logical process by using equation (15) for an earthquake at a known position, where x=0 km, y=0 km, and z=10 km from the northeast. The yellow stars denote both the epicenter and hypocenter, the red circle also denotes the hypocenter, and the solid triangles represent the seismic stations in Network 1.
Again, the highest fuzzy output values correspond to the hypocentral location. While real hypocenter coordinates are determined using this method, coordinates are estimated as x=0.25 km, y=-0.25 km, and z=11 km under the nonideal conditions applied in this part of the current study. This method provides more accurate results by defuzzifying the values obtained from the sum of the four fuzzy outputs.
Implementing the location identifying procedure for real earthquake data
After examining the effectiveness of the method for determining the location of hypothetical earthquakes, the method was tested on real earthquakes. A total of 151 earthquakes that occurred in the eastern Black Sea near the coast were selected. Figure 12 is a topographic map of northeastern Türkiye showing the studied region and the seismic stations belonging to two national seismic networks where the data for events occurring in the northeastern Black Sea are obtained. A total of 151 earthquakes were selected for study because only Pg and Sg phase readings and locations determined by the seismological center were used, where the classical common inversion method, the Geiger method, was applied. The selected earthquakes were mostly offshore and occurred between 2000 and 2020. The selected earthquakes were located just outside two national seismic networks according to the distribution of national stations located on land. The data gathered from the European-Mediterranean Seismological Center (EMSC) include locations from several national and international seismological centers. The present study involved estimating the hypocenters of earthquakes using the forward method with a fuzzy logic approach, which was completed using the same data. The results from two methods, the classical method and the core method, were subsequently compared to each other to improve the accuracy of the location estimates, and the data were corrected with an appropriate station correction. As an example of the application of the method to real data, Figures 13 and 14 show the fuzzy outputs of paired PL2 and SL2 and PL1 and SL1 for an earthquake (Md=2.7) on March 6, 2009 (14:19:54.04). The epicenter and hypocenter determined by the seismological centers via the classical method are represented by red stars. Figure 15 illustrates the conclusion of the intersection process on all the fuzzy outputs of L2, SL2, PL1, and SL1. Note that the fuzzy outputs of L1 and SL1 are slightly greater than those of PL2 and SL2.
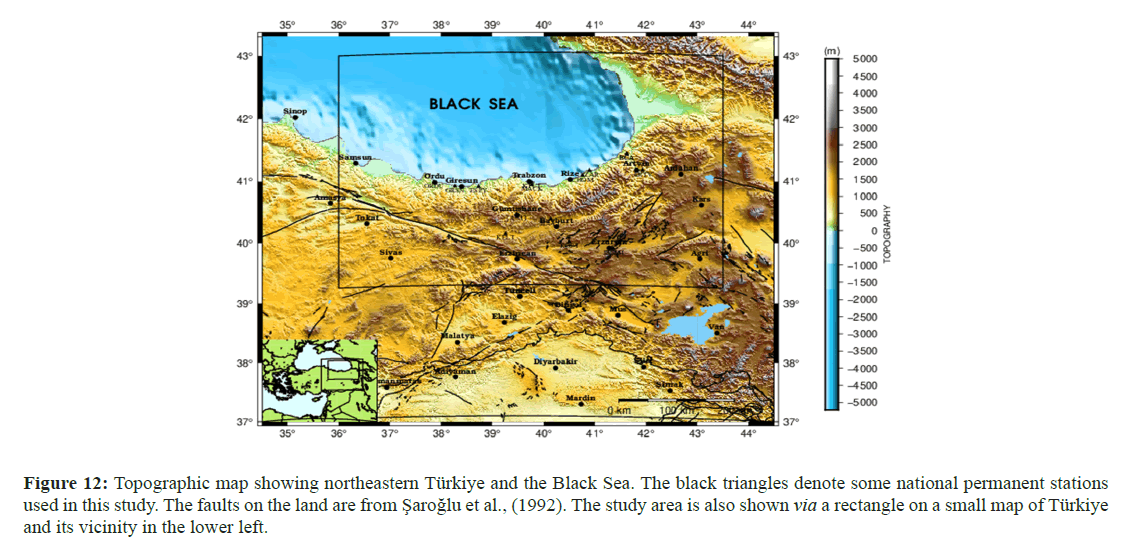
Figure 12: Topographic map showing northeastern Türkiye and the Black Sea. The black triangles denote some national permanent stations used in this study. The faults on the land are from Å?aroÄ?lu et al., (1992). The study area is also shown via a rectangle on a small map of Türkiye and its vicinity in the lower left.
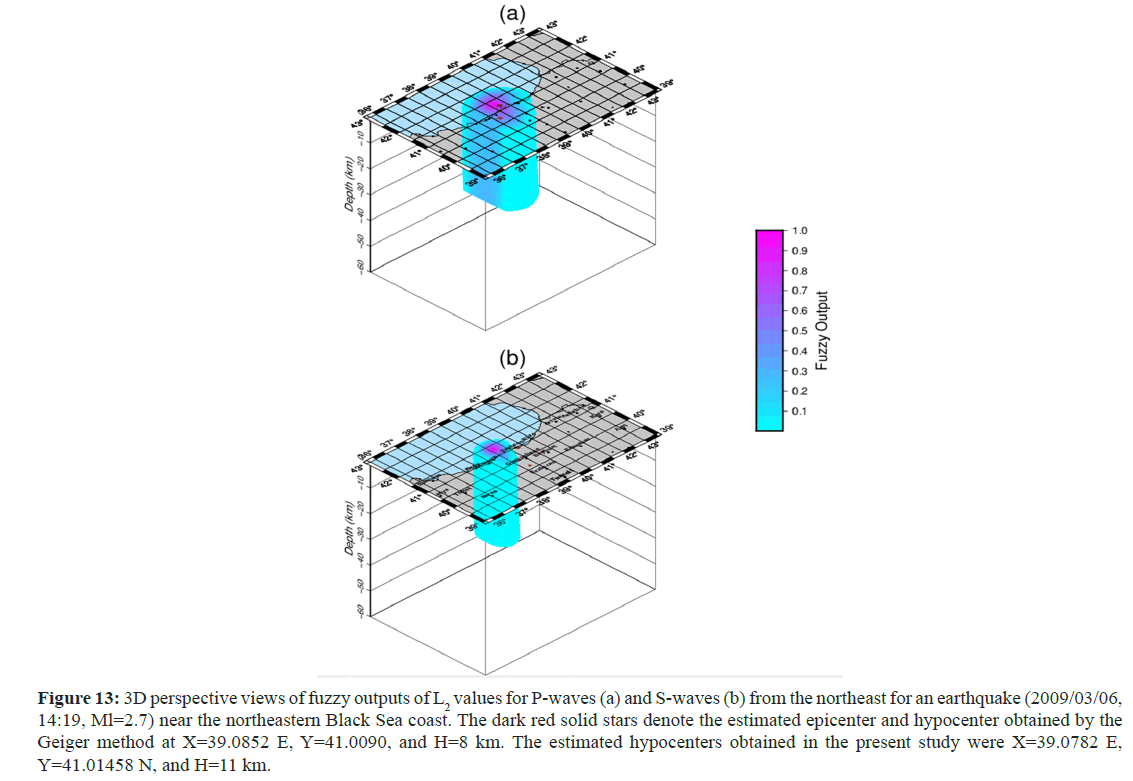
Figure 13: 3D perspective views of fuzzy outputs of L2 values for P-waves (a) and S-waves (b) from the northeast for an earthquake (2009/03/06, 14:19, Ml=2.7) near the northeastern Black Sea coast. The dark red solid stars denote the estimated epicenter and hypocenter obtained by the Geiger method at X=39.0852 E, Y=41.0090, and H=8 km. The estimated hypocenters obtained in the present study were X=39.0782 E, Y=41.01458 N, and H=11 km.
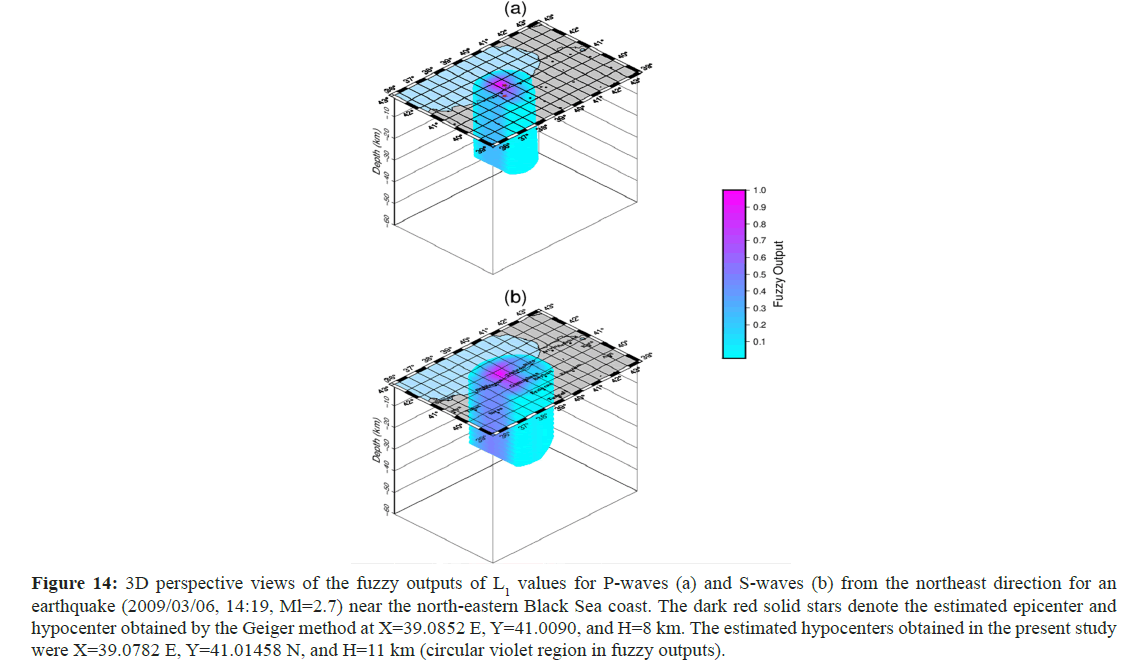
Figure 14: 3D perspective views of the fuzzy outputs of L1 values for P-waves (a) and S-waves (b) from the northeast direction for an earthquake (2009/03/06, 14:19, Ml=2.7) near the north-eastern Black Sea coast. The dark red solid stars denote the estimated epicenter and hypocenter obtained by the Geiger method at X=39.0852 E, Y=41.0090, and H=8 km. The estimated hypocenters obtained in the present study were X=39.0782 E, Y=41.01458 N, and H=11 km (circular violet region in fuzzy outputs).
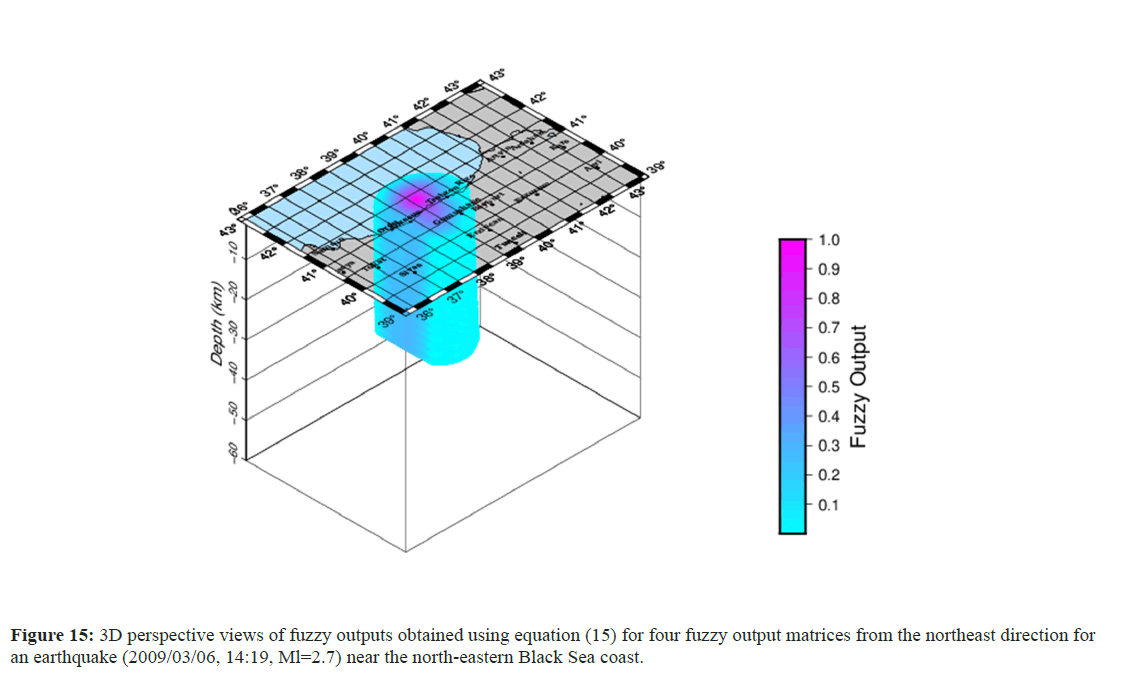
Figure 15: 3D perspective views of fuzzy outputs obtained using equation (15) for four fuzzy output matrices from the northeast direction for an earthquake (2009/03/06, 14:19, Ml=2.7) near the north-eastern Black Sea coast.
To convert the distance in kilometers to latitude/longitude and vice versa, the related subprogrammes (DIST and LAT) of the HYPOCENTER program (Lienert et al., 1986), in the code FORTRAN, were utilized. To calculate greater distances, geocentric coordinates were used instead of geographic coordinates. For the study area, a homogenous half-space model with a P-wave velocity of 5.98 km/s and an S-wave velocity of 3.42 km/s, which is needed to calculate travel times between trial epicenters and the stations, was obtained via simple velocity analysis of the region, as explained by Gökalp. The hypocenter coordinates obtained by the seismological center using the Geiger method were X=39.0846 E, Y=41.0121 N, and H=10.9 km. Using equation (16), as it gives the best result for real data, the same coordinates were estimated as X=39.09003 E, Y=41.02359 N, and H=7.0 km. From the defuzzification process of all the highest membership values indicating a value of 1 in this study, the coordinates were estimated as X=39.0782 E, Y=41.01438 N, and Z=11.0 km. It must be noted that the half trapezoidal membership functions have a rather dynamic function with changeable percentage values, which are different from those used in the abovementioned synthetic model studies. The percentages of the half trapezoidal functions were determined during the hypocenter location process by considering the maximum and minimum RMS values for each real earthquake.
Figure 16 shows the epicenter coordinates (top) and hypocentral locations, obtained using the two different techniques, of all the selected earthquakes that occurred near the northeastern coast of Türkiye. In the figure, red stars indicate the locations estimated by national seismological agencies (mostly ISCs) using the Geiger method, while blue stars represent the locations estimated by this study. The spatial difference between two estimated epicenters is depicted by the black line connecting two estimated locations of an earthquake using two different locating procedures. Figure 17 shows the spatial differences in kilometers between the two obtained hypocenters for each earthquake to more clearly observe the diversity in hypocentral coordinates between the two methods and reveal the performance of the two locating methods. Although the maximum differences were as high as 64 km, Figure 17 shows that the differences were reasonable and mostly close to approximately 10 km. Figure 18 shows the spatial differences across longitudes, latitudes, and focal depths between the two hypocenters obtained from each earthquake. The lowest difference obtained, which occurred for three seismic events, was approximately 0.15 km. The findings of this study demonstrate that the locations of most of the earthquakes selected were successfully estimated using this method [32].
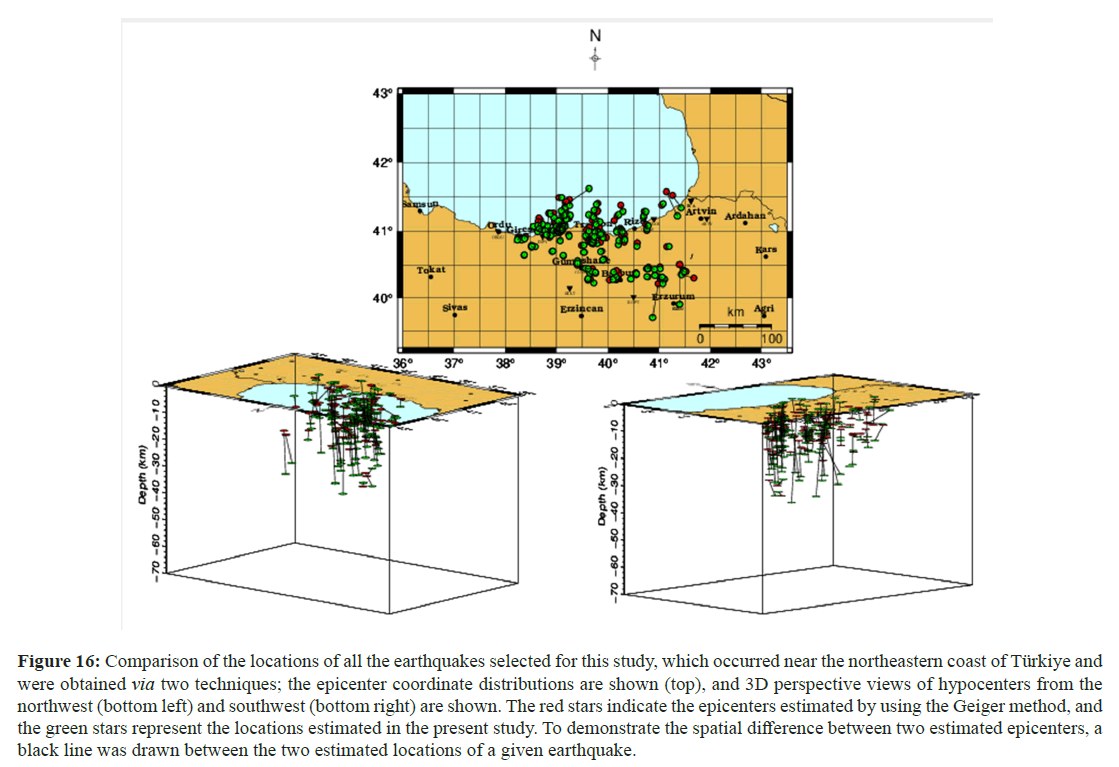
Figure 16: Comparison of the locations of all the earthquakes selected for this study, which occurred near the northeastern coast of Türkiye and were obtained via two techniques; the epicenter coordinate distributions are shown (top), and 3D perspective views of hypocenters from the northwest (bottom left) and southwest (bottom right) are shown. The red stars indicate the epicenters estimated by using the Geiger method, and the green stars represent the locations estimated in the present study. To demonstrate the spatial difference between two estimated epicenters, a black line was drawn between the two estimated locations of a given earthquake.
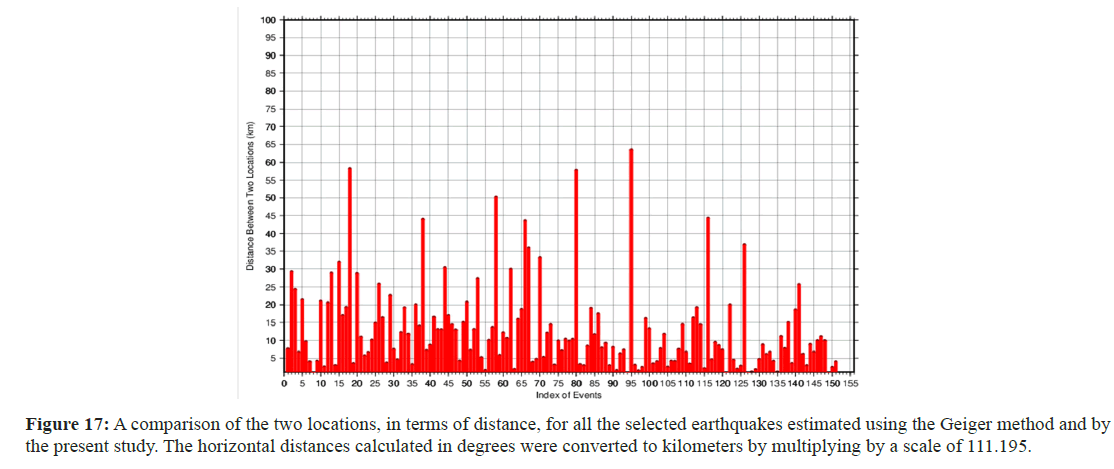
Figure 17: A comparison of the two locations, in terms of distance, for all the selected earthquakes estimated using the Geiger method and by the present study. The horizontal distances calculated in degrees were converted to kilometers by multiplying by a scale of 111.195.
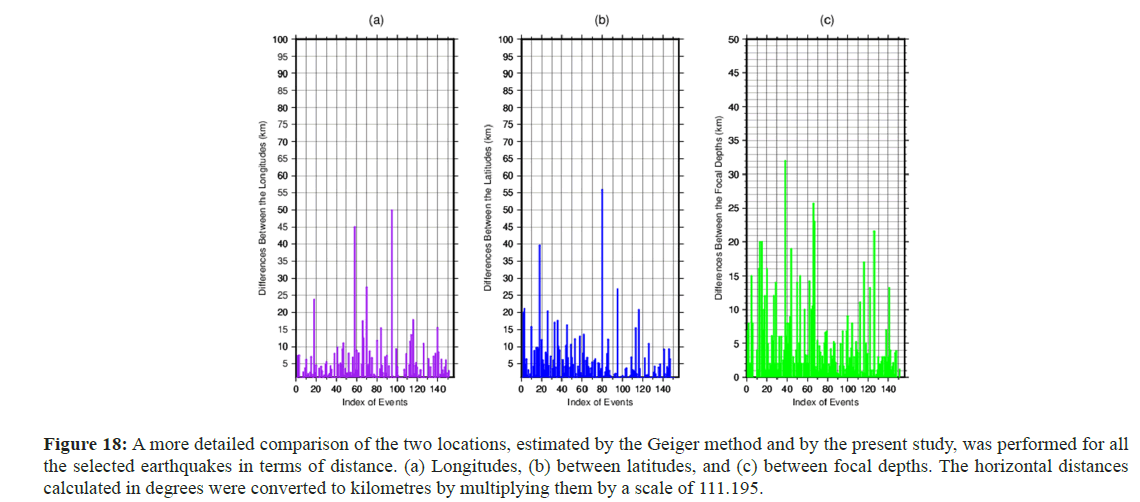
Figure 18: A more detailed comparison of the two locations, estimated by the Geiger method and by the present study, was performed for all the selected earthquakes in terms of distance. (a) Longitudes, (b) between latitudes, and (c) between focal depths. The horizontal distances calculated in degrees were converted to kilometres by multiplying them by a scale of 111.195.
Discussion
This study aimed to identify the locations of seismic events that occurred near or far from a seismic network using a forward modeling method employing grid search with a fuzzy logic approach. The data consisted of travel times recorded at seismic stations. This method uses a one-dimensional velocity model and only the arrival times of the Pg and Sg phases recorded by the stations in a seismic network. First, four kinds of RMS values were calculated through 3D grid nodes in a model. These values were then converted to fuzzy logic space using a half trapezoidal membership function, which was constructed considering the maximum and minimum RMS values in the case of real data. Uncertainties in arrival times, which are related to uncertainties in the velocity of the medium, were mapped into the fuzzy logic space using membership functions. The identified locations of the earthquakes were derived from the defuzzification process, which was based on the results of logic outputs in the logic space, using a searching grid area. This method offers two solutions: One obtained from the intersection process of four RMS values in the fuzzy logic space and the other from the defuzzification process using the maximum fuzzy output values.
First, the effectiveness of the method was investigated on synthetic models. With the gained experience, the method was subsequently applied to real earthquakes. For this purpose, three artificial seismic networks with different network geometries were selected. Additionally, hypothetical earthquakes were examined to determine whether they were in the middle, just outside, or on the edge of the networks, as well as outside. Furthermore, for the three seismic networks with different geometries, the effectiveness of the method was analyzed to evaluate whether seismic data are noisy when the origin time and ambient seismic velocity have been incorrectly determined.
Conclusion
Using synthetic models, the hypocenter locations of earthquakes that took place on the Earth’s surface were estimated. However, the epicenter location could be determined successfully when using the data without noise and under ideal conditions; that is, when the other earthquake parameters were known, there were uncertainties in the epicenter estimations when an event had a focal depth. The uncertainties in the epicenter estimations increased with increasing focal depth. The networks’ different geometries were observed to have an impact on the fuzzy output distribution of the figures, which could affect the solution. A more accurate solution can be obtained when fuzzy output anomalies grow rapidly and in a circular manner than when they grow slowly. For example, if an earthquake occurs far from a network, it has an ellipsoidal shape in the model; thus, the solution is probably influenced by station patterns. On the other hand, generally speaking, this method has proven more successful when an earthquake is quite far from a network with stations that are not too scattered and/or with stations located uniformly. Moreover, there was no significant difference in the epicenter estimates between noisy data and noiseless data for earthquakes that occurred at very shallow depths. In the case of hypocenters, that is, earthquakes with a focal depth, the geometries of the three networks impacted the location estimation of the earthquakes when noisy data were used in the implementation of the method. A more compact station distribution should be considered when considering the event location, as this should lead to less uncertainty in the solution.
The other case investigated, which is a common occurrence for seismological centers, involved assigning a fault value for both the velocity and the origin time and using data with a certain signal/ noise ratio in the implementation of the synthetic model method. The results obtained were comparable to those of previous cases for both the varied network geometry and the events that took place in the different hypothetical locations. Therefore, earthquake locations are estimated to be less ambiguous when they are located farther from a network. However, it was possible to estimate earthquake locations with a reasonable amount of uncertainty under nonideal conditions, particularly if earthquakes were located outside of the networks; in that latter case, more accurate location estimations were obtained.
Based on the results obtained from synthetic models, this method was applied to real earthquake data from earthquakes that occurred near the coast of the eastern Black Sea between 2000 and 2010. A total of 151 earthquakes that had both Pg and Sg phase readings were selected as a case study. The locations of the events, previously estimated by seismological centers using classical methods, were compared with the locations obtained using this method. A variety of locations were identified by different seismological centers, even for the same earthquakes; therefore, the closest solution (mostly ISC solutions) was chosen as a reference for comparison. The optimal velocity model was found to be Vp=5.98 km/s and Vs=3.42 km/s following evaluation of both the hypocentral distance and earthquake travel time.
Generally, the differences in epicentral fluctuations between this method and the classical method were marginally less than the differences in focal depth. Therefore, the epicenter estimates were much more successful than the hypocenter estimates.
The few significant differences in hypocentral estimation encountered during the location identification process were due to the recording of earthquake data from seismic stations with different levels of site noise. Although the 61 km hypocenter difference is not large, significant differences in earthquake location estimation can occur when seismic agencies utilize the same method; therefore, this method could yield more satisfactory results for such estimations.
Acknowledgment
The authors would like to thank Dr. Tahir Serkan Irmak and the anonymous reviewers for their helpful comments, which led to the improvement of the manuscript. No funding was received for this work. The authors declare that there are no known conflicts of interest associated with this publication and that there has been no significant financial support for this work that could have influenced its outcome. The author affirms that he provided informed consent for the publication of the images in all the figures. The figures were generated by using the Generic Mapping Tools (Wessel and Smith 1998).
References
- Geiger L (1912) Probability method for the determination of earthquake epicentres from the arrival time only. Bull. St. Louis Univ. 8:60.
- Lee WH, Lahr JC (1975) HYPO71 (revised; a computer program for determining hypocenter, magnitude, and first motion pattern of local earthquakes.
- Klein FW (1978) Hypocenter location program HYPOINVERSE: Part I. Users guide to versions 1, 2, 3, and 4. Part II. Source listings and notes. US Geological Survey.
- Herrmann RB (1979) FASTHYPO-a hypocenter location program. Earthquake Notes. 50(2):25-38.
- Lahr JC (1989) Hypoellipse/Version 2.0: A computer program for determining local earthquake hypocentral parameters, magnitude, and first motion pattern.
- Lienert BR, BergE, Frazer LN (1986). HYPOCENTER: An earthquake location method using centered, scaled, and adaptively least squares. Bull Seism Soc Am. 76: 771-783.
- Hartse HE (1991) Simultaneous hypocenter and velocity model estimation using direct and reflected phases from micro earthquakes recorded within the central Rio Grande rift, New Mexico.
- Waldhauser F, Ellsworth WL (2000) A double-difference earthquake location algorithm: Method and application to the northern Hayward fault, California. Bull Seismol Soci Am. 90(6):1353-68.
- Pujol J (2003) Software for joint hypocentral determination using local events. Int Geophy.81: 1621-1623.
- Dewey JW. Seismicity and tectonics of western Venezuela (1972) Bull Seism Soc Am. 62(6):1711-51.
- Sambridge M (2003) Nonlinear inversion by direct search using the neighbourhood algorithm.
- Oye V, Roth M (2003) Automated seismic event location for hydrocarbon reservoirs. Computers & Geosciences. 29(7):851-63.
- Lee WH, Baker LM (2006) Development of a direct search software package for locating poorly constrained earthquakes. Seism Res Lett. 77:291-2.
- Lee WHK, Dodge DA (2007) Development of a direct search software package for poorly constrained earthquakes.
- Gökalp H (2021) Determination of locations of local and regional earthquakes by grid search methods. Pamukkale Univ J Engineering Sciences. 27(3):392-409.
- Lin K, Sanford RA (2001). Improving regional earthquake using a modified g matrix and fuzz logic. Bull Seism Soc Am. 91: 82-93.
- Gökalp H (2018). Improvements to earthquake location with a fuzzy logic approach. Pure Appl Geophys. 175 (1): 341–363.
- Saroglu F, Emre O, Kuscu I (2018) Active fault map of Turkey. Bull Earthquake Engi.16: 3229–3275
- Zadeh LA (1965) Fuzzy sets. Informat. Control.8, 338–353.
- Mendel JM (1995) Fuzzy logic systems for engineering: A tutorial. IEEE. 83(3):345-77.
- Kandel A (1986) Fuzzy mathemetical techniques with application. ACM Dig Lib.
- Zimmermann HJ (2011) Fuzzy set theory-and its applications.
- Yager RR, Zadeh LA (2012) An introduction to fuzzy logic applications in intelligent systems.
- Jamshidi M, Vadiee N, Ross T (1993) Fuzzy logic and control: Software and hardware applications.
- Marks II RJ (1994). Fuzzy logic technology and applications.
- Fuzzy control programming. 1997.
- International electro technical commission. 1997.
- Havskov J, Ottemoller L (2010) Routine data processing in earthquake seismology: With sample data, exercises and software.
- Saroglu F, Emre Ö, Kusçu I (1992) Active fault map of Turkey. 1992; 2.
- Lomax A, Virieux J, Volant P, Berge TC (2000). Probabilistic earthquake location in 3D and layered models. Modern Approaches in Geophysics.
- Anglin FM (1971) Detection capabilities of the yellowknife seismic array and regional seismicity. Bull Seism Soc Am. 61(4), 993-1008.
- Wessel P, Smith WH (1998) New, improved version of generic mapping tools released. Eos transactions Am geophy Union. 79(47):579.
 Spanish
  Chinese
  Russian
  German
  French
  Japanese
  Portuguese
  Hindi
Hindi 
