Spanish
  Chinese
  Russian
  German
  French
  Japanese
  Portuguese
  Hindi
Hindi Research Article, J Appl Bioinforma Comput Biol Vol: 12 Issue: 1
Consolidated Optimization Method based on GASA-SVM for Predicting Protein-Protein Interactions from Protein Sequences
Saeideh Mahmoudian*, Abdulaziz Yousef and Nasrollah Moghadam Charkari
Department of Electrical and Computer Engineering, Tarbiat Modares University, Tehran, Iran
*Corresponding Author: Saeideh Mahmoudian
Department of Electrical and Computer Engineering,Tarbiat Modares University, Tehran, Iran
Tel: 989127315044;
E-mail: s.mahmoudian@gmail.com
Received date: 17 January, 2023, Manuscript No. JABCB-23-67551;
Editor assigned date: 19 January, 2023, PreQC No. JABCB-23-67551 (PQ);
Reviewed date: 02 February, 2023, QC No. JABCB-23-67551;
Revised date: 09 February, 2023, Manuscript No. JABCB-23-67551 (R);
Published date: 16 February, 2023, DOI: 10.4172/2329-9533.1000247.
Citation: Mahmoudian S, Yousef A, Charkari NM (2023) Consolidated Optimization Method based on GASA-SVM for Predicting protein- Protein Interactions from Protein Sequences. J Appl Bioinforma Comput Biol 12:1.
Abstract
Protein Protein Interaction (PPI) data is essential for understanding cellular and biological processes. Therefore, PPI identification plays an important role in comprehending these processes and detecting the reasons for numerous diseases progression, such as COVID-19. Since experimental methods of PPI identification are time consuming, costly, and inaccurate, numerous machine learning approaches have been developed for this purpose. Using these approaches leads to noise reduction and more accurate and general PPI prediction. This paper proposed a sequence based framework for predicting PPIs called GASA-SVM. The proposed framework uses a Support Vector Machine (SVM) with Gaussian Radius Basis-kernel Function (RBF) for classification. The performance and classification accuracy of the SVMs are highly dependent on the kernel parameters and the selection of an appropriate subset of features. The Principal Component Analysis (PCA) method is employed as a feature extraction algorithm to reduce the training time and minimize the impact of noisy PPI data. A combination of the Genetic Algorithm (GA) and Simulated Annealing (SA) is then used to select the most significant features and determine the optimal values of the SVM kernel parameters. Our proposed method can successfully predict PPIs with an accuracy of 96.373% on Saccharomyces cerevisiae, and with an accuracy of 75.31% on KUPS (The University of Kansas Proteomics Service) dataset which outperforms the other methods. According to the experimental results, GASA-SVM can effectively reduce the number of features while maintaining high prediction accuracy compared to the other available methods.
Keywords: Protein-protein interaction, Support vector machine, Feature extraction, Genetic algorithm, Simulated annealing
Introduction
Most cellular activities occur through interaction between proteins [1,2]. Protein–protein interactions are important to examine cells functions, protein functions, signaling pathways, diagnosis of cancer cells, disease related proteins and to determine the cause and progression of diseases. Nowadays that the world is encountering the challenge of COVID-19, it is more important to have a better understanding about the mechanisms of pathogenesis, in order to find effective resolutions [3-10].
Although detecting PPIs among protein pairs is very important, is not easy because the number of protein pairs is exponential relative to the number of proteins. On the other hand, PPI information extracted using high-performance laboratory techniques such as Yeast Two Hybrid (Y2H), Mass Spectrometry (MS) and Coimmunoprecipitation (CoIP), etc., is often incomplete and noisy [11-13]. Moreover, these processes are both costly and time consuming [14,15].
Nowadays, using engineering science to solve biological and medical problems is growing rapidly and successfully. The ultimate goal of developing these systems is to make the decision made by the machine as close as possible to that made by expert biologists. Therefore, many attempts have been made to develop high performance computational methods to classify protein pairs as interactive or non-interactive [16,17]. These methods differ mainly in the type of data and the machine learning algorithm used for prediction.
Due to the availability of protein sequence information, numerous studies have focused on PPI prediction through machine learning techniques and protein sequence data [18,19]. Considering the different amino acid sequence lengths for different proteins, the feature vectors extracted from different protein pairs have different lengths. On the other hand, Artificial Intelligence (AI) techniques, such as Support Vector Machines (SVMs) and neural networks require a fixed length input for training. Accordingly, various methods such as Conjoint Triad (CT), n grams and autocorrelation have been proposed to construct a dataset based on protein sequences and convert the protein pair sequences with heterogeneous lengths into feature vectors of homogeneous length [20-25].
Many interesting supervised classification methods, such as naïve Bayes, SVM, decision tree, random forest, k nearest neighbors and methods based on Artificial Neural Networks (ANNs), and deep learning are used for PPIs prediction.
Yusuf, et al. used a multilayer approach to predict PPIs. They employed six different methods in the first layer to represent the features of each PPI sequence. The PCA algorithm was used in the feature extraction layer. Finally, a method called multiple new adaptive LVQ was used as the classifier to predict PPIs.
Mahmoudian, et al. used the PCA feature selection algorithm to obtain an optimal subset of features. The Support Vector Regression (SVR) algorithm was then employed to predict PPIs. The parameters of the SVR algorithm were optimized using a new Parallel Hierarchical Cube Search (PHCS), and the proposed scheme was called SVR-PHCS.
Bandyopadhyay, et al. proposed a new method for generating the feature vectors based on annotated gene ontology to improve the prediction accuracy. The SVM algorithm with RBF kernel functions predicted new protein pairs. The optimal values of SVM parameters were determined via grid search.
Sandra et al. presented a novel sequence based PPI predictor called PPI-detect. The protocol was first extended to encode pairs of amino acid sequences and then used to map a pair of amino acid sequences into a fixed-length feature vector. An SVM model was then used to predict PPIs. The model parameters were optimized using the grid search approach.
Chen, et al. used the XGBoost method to reduce the noise and dimensionality of features. A stacked ensemble classifier called StackPPI was used to analyze the obtained optimal feature set. The ensemble classifier employed logistic regression, random forest, and extremely randomized trees for prediction.
SVM and random forest classifier are two commonly used machine learning methods for PPI prediction. According to the literature, the SVM model combined with RBF kernel functions has the best performance in solving complex biological classification problems, such as predicting PPI pairs. However, SVMs suffer from several obvious disadvantages: 1) The number of support vectors increases linearly with the size of the training set. 2) Setting the model parameters to their optimal values is an essential step, significantly affecting the performance and generalization capabilities of the classifier. Parameter optimization is considered the primary bottleneck of SVM models.
To the best of our knowledge, few studies have focused on optimizing the SVM parameters. Moreover, most studies rely on time consuming, inaccurate grid search for optimization. Most recent studies use a filter based feature extraction algorithm to reduce the effect of noisy PPI data and accelerate the training process.
Our proposed method for PPI prediction is based on protein primary structure data and SVM. The GASA-SVM scheme proposed in this article combines genetic algorithms and simulated annealing with SVM to provide an optimal classifier. In the first place, PCA algorithm is applied on dataset as a filter based feature extraction method. After normalizing outputs, a combination of evolutionary algorithms is utilized to simultaneously extract wrapper based features and optimize SVM parameters. Thus, the proposed method maximizes the accuracy rate of the SVM classifier.
The remainder of this paper is organized as follows. Section 2 discusses SVMs and data preprocessing. The datasets and the proposed method (GASA-SVM) are presented in Section 3. Performance evaluation and experimental results are provided in Section 4 and concluding remarks are presented in section 5.
Background
Support vector machine
Support Vector Machine (SVM) is a classification technique proposed by Vapnik, et al. The main idea of SVM is mapping the nonlinear inseparable data into a linear high dimensional feature space F by using a transformation φ →: RN F, then the optimal hyper plane H: f(x) =ω .φ(x) +b) can be obtained by solving the optimization problem as follows:

Where ω is the coefficient vector of the hyper plane in feature space, b is the hyper plane’s threshold value, εi is the slack factor introduced for errors in classification, C is the penalty factor for errors.
However, as ω=ΣIi=1 αi yi φ (xi) all operations of SVM in feature space are only dot product operations. Then kernel function K (xi, xj) = φ (xi). φ (xj) was introduced for SVM.
The method proposed for predicting PPIs is based on SVM. The kernel functions are employed to solve a high dimensional problem using this method. Various functions, such as sigmoid, polynomial, and Radius Basis Function (RBF) can be used as kernel functions. The main objective of using kernel functions is to increase the distance between the hyper planes. An SVM classifier with RBF kernel functions was used to implement the proposed approach because they can analyze higher dimensional data and only have two parameters, C and γ, to fine-tune. Selecting the optimal values for C and γ parameters in the RBF kernel function based on the nature of the problem is an essential step, affecting the classification performance and generalization abilities of the trained classifier. Our proposed method also tries to optimize these parameters using a meta heuristic method which is based on a combination of Genetic Algorithm (GA) and Simulated Annealing (SA).
Data preprocessing
Most of the available machine learning methods used for PPIs utilizes the whole feature set. However, some features in the high dimensional feature set most likely do not provide significant information. Using inappropriate features hinders the learning process, while proper feature selection in high dimensional datasets can decrease search time and increase accuracy by removing outliers.
As a data preprocessing method, the feature selection algorithms can be categorized into two groups: Filter based and wrapper based algorithms. The wrapper based methods evaluate the fitness of a subset of the feature set based on the prediction accuracy of the classifier built using those features. Therefore, the wrapper based feature extraction methods are slow but accurate. On the other hand, the filter based methods evaluate the discriminative power of the selected features in general and use a metric independent of the target classification algorithm. The filter based feature extraction methods are independent of the training phase and thus are faster and less accurate. To benefit from the advantages of both groups and avoid their disadvantages, a feature extraction method was used to combine filter based and wrapper based methods.
Materials and Methods
Datasets
The KUPS dataset and the S. cerevisiae dataset from the DIP database are used to evaluate and compare the performance of the proposed method. The KUPS dataset is generated by integrating seven databases: MINT, IntAct, HPRD, Gene Ontology, Uniprot, AAindex, and PSSM. It includes PPIs from numerous organs and contains more PPIs than other interaction datasets. The dataset consists of 400 features and is divided into training and test subsets, respectively, with 10518 and 10516 samples. The S.cerevisiae dataset consists of 5594 interactive protein pairs and 5594 noninteractive protein pairs collected from different sub cell locations. In other words, the final dataset consists of 11188 protein pairs, half of which are positive samples and the other half are negative samples. The geary autocorrelation method was used to generate the feature vectors, resulting in a dataset consisting of 11188 samples and 360 features. Forty percent of the samples were selected for the test set and the rest for the training set. The experiments were repeated five times with different training and test sets to reduce the effect of random selection. The proposed method has achieved very good results on both datasets.
GASA-SVM algorithm
As previously mentioned, our proposed PPI prediction method is based on an SVM. The proposed method combines filter based and wrapper based feature extraction to obtain an optimal feature set. The PCA algorithm is first used as a filter based feature extraction method.
A good search algorithm must meet several conditions: 1) Global search capability without getting stuck in local minima, 2) Rapid convergence to a near optimal solution, 3) Good local search capability, and 4) Computational efficiency. A new hybrid algorithm named GASA is presented to satisfy the above conditions that combine GA, SA, and SVM for parameter optimization and feature selection using a wrapper based approach. The proposed scheme consists of the following steps (Figure 1):

Figure 1: Steps of GASA-SVM method.
• Filter based feature selection using the PCA algorithm.
• Data scaling.
• Hybrid optimization strategy for feature selection and parameters optimization for SVM.
• Each step is explained in more detail in the remainder of this section
Filter based feature selection: Dimensionality reduction increases the accuracy and reduces the processing time of the algorithm. The first step in the proposed approach reduces the number of features using the PCA algorithm. Principal Component Analysis (PCA) is a useful statistical technique first presented. PCA creates a new feature set with fewer features than the original feature set, while still being a good representative of it. In other words, the original dataset can be stored and represented by fewer features, with minimum information loss and maximum accuracy.
Data scaling: Data should be normalized before passing the input data to the SVM model. Thus, data is normalized before being used in the training of the models. A major advantage of data normalization is preventing the numerical errors that might occur during the computation. Furthermore, data normalization minimizes the effect of the variable scales of different features, ensuring that all input parameters are in the same range. Equation 2 is used for data normalization:
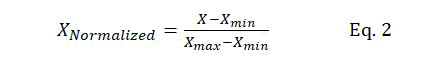
Where X represents the original dataset, XNormalized normalized data, and Xmax and Xmin the maximum and minimum values of X, respectively.
Hybrid optimization strategy for feature selection and parameters optimization using SVM: There are two important concepts in hybrid evolutionary optimization algorithms: Exploitation and exploration. Exploitation is the capability of an algorithm to exploit the previously searched space. However, exploration is the ability of an algorithm in the global search and scan of the search space. Excessive exploitation increases the risk of getting stuck in local optima, while too much exploration might deviate the algorithm from the optimal solution or increase the convergence time. Therefore, an evolutionary algorithm needs to balance exploitation and exploration to achieve an appropriate solution. However, the exploitation capability of the GA is better than its exploration abilities, and premature convergence might prevent it from obtaining the optimal solution. Therefore, we need a strategy to improve the exploration abilities of this algorithm while covering a wider area of the search space.
The proposed method uses a local search algorithm to balance between exploitation and exploration. Once the genetic algorithm creates a new generation using selection, crossover, and mutation operators, the local search algorithm is applied to modify the newly formed solutions and expand the search area. Expanding the search area increases the probability of finding an optimal or near optimal solution. Various meta heuristic algorithms such as hill-climbing, SA, and Particle Swarm Optimization (PSO) can be used for local search. The SA algorithm is used in this study due to its nature. It was found that the hill climbing algorithm cannot maintain the explorationexploitation balance and often gets stuck in the local optima. Accordingly, the SA algorithm was proposed to resolve the problem, as it can select a less optimal solution with a certain probability, helping the algorithm escape the local optima. Therefore, the SA algorithm is used to improve the exploration capabilities of the GA. Figure 2 shows the details of the hybrid GA-SA algorithm.

Figure 2: The details of the hybrid GA-SA algorithm.
Chromosome design and fitness function: The candidate solutions to the problem are represented by a fixed length chromosome. Each chromosome is encoded as a binary vector of 1's and 0's. RBF kernel functions are used, so C and γ and the selected input features must be optimized using the proposed GASA algorithm. In our GA, each chromosome has three parts corresponding to C and γ and the feature set (Figure 3).
In Figure 3, the binary sequences representing the genotype of C and γ must be converted into their phenotypes using Equation 3. For the part of the chromosome corresponding to the selected features, 1 means a feature in the selected feature set, while 0 means that it is not selected.

Figure 3: The structure of chromosomes in the proposed GA.
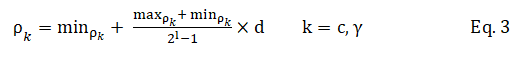
In the above equation, ρk is the decoded value, min ρk and max ρk the minimum and maximum allowed values of ρk, d the value of the chromosome and l is its length.
The SVM accuracy is used as the fitness function. The chromosomes with higher fitness values have a higher probability of being preserved in the next generation.
Genetic operations (selection, crossover, and mutation): It is difficult to select those chromosomes subjected to the GA operators according to their fitness values. The Roulette wheel selection is used for this purpose. The size of the Roulette wheel sectors is proportional to the fitness value of the chromosomes.
Three one point crossovers are used, one for each part of the chromosome (C, γ and the features). A random gene of the chromosome is selected, and its state is toggled using the mutation operator (Figure 4).

Figure 4: Three one-point crossovers for each part of the chromosome.
The population size of the GA is fixed (in the proposed algorithm, the population always consists of a set of 100 chromosomes). The initial population is created randomly. Mutation and crossover operations are applied in each iteration to all chromosomes with 10% and 90% probability to increase the initial population. A fixed number of chromosomes (equal to the initial population) with the highest fitness values is then selected from the resulting population to create the next generation.
New solution generator of SA: In addition to using the mutation operator, the SA algorithm is applied to each member of the newly created a population in each iteration to prevent premature convergence. The SA algorithm improves the solution at a specific temperature, and the modified solution is returned to the population. A chromosome modified in the SA replaces its counterpart in the population only if one of the following conditions is met:
• If the new chromosome is more fit than its counterpart. Otherwise,
• If the replacement probability is more than a randomly selected value between 0 and 1.
The replacement probability mentioned in condition (2) is equivalent to the acceptance probability in SA determined using equation 4.
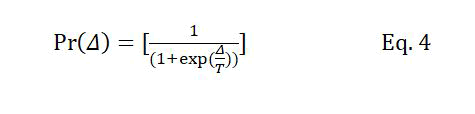
Where Δ is the difference between the fitness of the new chromosome and its counterpart in the population. T is the temperature level at the current iteration, which is decreased at the beginning of each iteration according to Tk+1=Tk × r, where r is the temperature reduction coefficient, and Tk and Tk+1 are temperatures at iterations k and k+1, respectively. The number of iterations of the GA is determined based on the initial temperature and the temperature reduction parameters of the SA algorithm.
The initial temperature must be high enough to ensure that all the states can be visited with the same probability. It also must not be too high to lead to unnecessary search and increased processing time. A linear temperature reduction strategy is used in this study. The initial temperature of 100 and r=100 are used in the simulations as they seem appropriate according to our experiments with different values.
Results and Discussion
Performance evaluation
Classification rate (accuracy), precision, recall, and F-measure are the metrics usually used to evaluate supervised machine learning algorithms. These metrics are defined as follows:
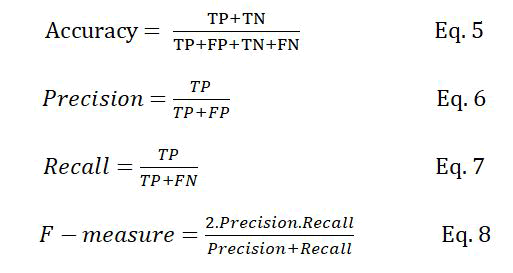
Where TP is the number of true positive samples, which are the correctly classified PPI samples, FP is the number of non-interactive protein pairs that are incorrectly classified as interactive, TN is the number of non-interactive protein pairs that are correctly classified and FN is the number of interactive protein pairs that are incorrectly classified as non-interactive.
The classification rate represents the number of samples that are correctly classified. Precision determines that how many of the samples classified as positive actually belong to the positive class. In contrast, recall determines how many of the positive samples are correctly classified. Precision and recall are two conflicting metrics; increasing one of them might lead to the reduction of the other and vice versa. The F measure is used as a trade off between the two metrics, defined as the harmonic mean of precision and recall.
Prediction assessment
To validate the capabilities of the proposed model, it was applied to two reliable datasets: KUPS and S. cerevisiae. Table 1 lists the results of applying the proposed model to the KUPS dataset for PPI prediction. As shown, the optimal values for C, γ, and the number of features are 2.037, 8.205 and 196 respectively. Accuracy, precision, recall, and F measure for this dataset equal 75.31%, 77.8%, 70.84% and 74.16% respectively. Table 2 reports the results of applying the proposed model for PPI prediction in S. cerevisiae dataset. Accuracy, precision, recall and F-measure for this dataset are 96.373%, 96.959%, 95.749% and 96.35% respectively. The reported results are obtained using the optimal values of C, γ and the number of features, which are equal to 3.0117, 2.9194 and 23 respectively.
Table 1: Prediction performance of GASA-SVM on the KUPS dataset.
Table 2: Prediction performance of GASA-SVM on the S. cerevisiae dataset.
Comparison with other supervised learning algorithms
To evaluate the performance of GASA-SVM, its results were compared with those of four basic machine learning algorithms: SVM, decision tree (C4.5), naive Bayes, and K nearest neighbors. The Weka software is used to implement these algorithms. The 5 fold cross validation technique is used to evaluate the algorithms on KUPS, and S. Cerevisiae datasets, and the reported results are obtained by averaging over these five runs.
Table 3 compares the performance of the proposed algorithm with those of the above mentioned supervised learning algorithms on KUPS and S. Cerevisiae datasets.
Table 3: Performance comparison of GASA-SVM with other supervised learning algorithms on KUPS and S. cerevisiae datasets
Comparison with other SVM based approaches
GA-SVM and SA-SVM were also implemented for better comparison. Like GASA-SVM, these two SVM based models also optimized the SVM parameters and the feature set, simultaneously. Table 4 compares the classification rate of the proposed algorithm with those of these two methods and a simple grid search algorithm. The experiments were repeated five times to achieve more reliable results and the mean and variance of these five runs are reported.
Table 4: Classification accuracy comparison of GASA-SVM with other methods on KUPS and S. cerevisiae datasets.
Comparison with other methods
Various models have been proposed to predict PPIs. To evaluate the proposed model effectively, its performance was compared with those of the available methods. Table 5 reports the results of different methods for the KUPS dataset. As shown, the proposed model with reported values of 75.31%, 77.08%, 70.84% and 74.16 % for Accuracy, Precision, Recall and F-measure, outperforms the other methods.
Table 5: Comparison of different PPIs prediction methods on KUPS dataset.
Precision and recall are two conflicting metrics; increasing one might lead to a decrease in the other and vice versa. The F-measure provides a trade off between the two metrics, defined as the harmonic mean of precision and recall. Increasing precision at the cost of a significant decrease in recall is not desirable, and both metrics should be increased simultaneously. Therefore, classification rate and Fmeasure are the best metrics for comparing different methods. According to these metrics, our proposed method outperforms the others.
Table 6 shows the results of several methods on the S. Cerevisiae dataset. As shown, the proposed model with reported values of 96.373, 96.959, 95.749 and 96.35 for accuracy, precision, recall and Fmeasure, outperforms the other methods.
Table 6: Comparison of different PPIs prediction methods on S. Cerevisiae dataset.
Conclusion
Numerous techniques are available in the literature to classify PPIs. This paper developed an SVM based method for PPI prediction only using the primary sequence of proteins. SVM is a well-known classification algorithm, but its performance and classification accuracy are highly dependent on the configuration of the kernel function parameters according to the nature of the problem and appropriate feature selection.
The PCA feature extraction algorithm was first employed to reduce the dimension of the feature set and extract structural features. A hybrid optimization algorithm (GASA) was then proposed to combine the GA and SA algorithms. The proposed algorithm was employed to select the most significant features and determine the optimal values of the kernel function parameters of the SVM model. The GASASVM algorithm could overcome the early convergence problem, observed in GA, and escape the local optima. The proposed algorithm maximized the prediction accuracy of PPIs. Therefore, this value was used as the fitness function.
For the first time in this paper, a combination of evolutionary algorithms was used to predict PPIs. The wrapper based and filter based feature extraction algorithms were also combined to select the best features.
The proposed method showed an acceptable performance with PPI prediction accuracies of 75.31 and 96.373 in KUPS and S. Cerevisiae datasets, respectively. According to the experimental results, compared to other PPI prediction methods, the performance of the proposed scheme was competitive and promising. In future works, we aim to increase the efficiency of the proposed algorithm and reduce its process time. We will also consider other combinations of classification methods and optimization algorithms to achieve higher classification accuracy.
Acknowledgments
We would like to thank Dr. Fatemeh Golpayegani, Assistant Professor at University College Dublin and Mr. Saeid Vakilian, Senior Researcher at Universiry of Nizwa for their valuable comments and suggestions and Mr. Masoud Maghsoudi for his useful contributions.
Conflict of Interest
All authors declare that they have no conflicts of interest.
References
- Gentleman R, Huber W (2007) Making the most of high-throughput protein-interaction data. Genome Biol 8:1–10.
[Crossref] [Googlescholar] [Indexed]
- Hart GT, Ramani AK, Marcotte EM (2006) How complete are current yeast and human protein-interaction networks?. Genome Biol 7:1–9.
- Amar D, Hait T, Izraeli S, Shamir R (2015) Integrated analysis of numerous heterogeneous gene expression profiles for detecting robust disease-specific biomarkers and proposing drug targets. Nucleic Acids Res 43:7779–7789.
- Srinivasulu YS, Wang JR, Hsu KT, Tsai MJ, Charoenkwan P, et al. (2015) Characterizing informative sequence descriptors and predicting binding affinities of heterodimeric protein complexes. BMC Bioinformatics 16:S14.
- Gitter A, Klein-Seetharaman J, Gupta A, Bar-Joseph Z (2011) Discovering pathways by orienting edges in protein interaction networks. Nucleic Acids Res 39:4:e22–e22.
- Ruffalo M, Bar-Joseph Z (2019) Protein interaction disruption in cancer. BMC Cancer 19:370.
[Crossref] [Googlescholar][Indexed]
- Nguyen TP, chung Liu W, Jordán F (2011) Inferring pleiotropy by network analysis: Linked diseases in the human PPI network. BMC Syst Biol 5:1–13.
- Yang S, Li H, He H, Zhou Y, Zhang Z (2019) Critical assessment and performance improvement of plant–pathogen protein–protein interaction prediction methods. Brief Bioinform 20:274–287.
[Crossref] [Googlescholar][Indexed]
- Alakus TB, Turkoglu I (2021) A Novel Protein Mapping Method for Predicting the Protein Interactions in COVID-19 Disease by Deep Learning. Interdiscip Sc Comput Life Sci 13:44–60.
- Sharma S, Aroura S, Gupta A, Priyadarshini A (2022) Bioinformatics in Diagnosis of COVID-19, in Assessing COVID-19 and Other Pandemics and Epidemics using Computational Modelling and Data Analysis, Springer International Publishing, Cham, Switzerland, pp. 197–219.
- Ito T, Chiba T, Ozawa R, Yoshida M, Hattori M, et al. (2001) A comprehensive two-hybrid analysis to explore the yeast protein interactome. Proc Natl Acad Sci 98:4569–4574.
- Ho Y, Gruhler A, Heilbut A, Bader GD, Moore L, et al. (2002) Systematic identification of protein complexes in Saccharomyces cerevisiae by mass spectrometry. Nature 415:180–183.
- Gavin AC, Aloy P, Grandi P, Krause R, Boesche M, et al. (2006) Proteome survey reveals modularity of the yeast cell machinery. Nature 440:631–636.
- Alakus TB, Turkoglu I (2019) Prediction of Protein-Protein Interactions with LSTM Deep Learning Model. In 2019 3rd International Symposium on Multidisciplinary Studies and Innovative Technologies (ISMSIT), 11-13 October 2019, Ankara, Turkey, pp. 1–5.
- Wang L, Wang HF, Liu SR, Yan X, Song KJ (2019) Predicting Protein-Protein Interactions from Matrix-Based Protein Sequence Using Convolution Neural Network and Feature-Selective Rotation Forest. Sci Rep 9:9848.
- Sarkar D, Saha S (2019) Machine-learning techniques for the prediction of protein-protein interactions. J Biosci 44, no. 4, Sep. 2019.
[Crossref] [Googlescholar][Indexed]
- Dey L, Chakraborty S, Mukhopadhyay A (2020) Machine learning techniques for sequence-based prediction of viral–host interactions between SARS-CoV-2 and human proteins. Biomed J 43:438–450.
[Crossref] [Googlescholar][Indexed]
- An JY, You ZH, Meng FR, Xu SJ, Wang Y (2016) RVMAB: Using the Relevance Vector Machine Model Combined with Average Blocks to Predict the Interactions of Proteins from Protein Sequences. Int J Mol Sci 17:757.
- Hashemifar S, Neyshabur B, Khan AA, Xu J (2018) Predicting protein–protein interactions through sequence-based deep learning. Bioinformatics 34:i802–i810.
- Chen Z, Zhao P, Li F, Marquez-Lago TT, Leier A, et al., iLearn: an integrated platform and meta-learner for feature engineering, machine-learning analysis and modeling of DNA, RNA and protein sequence data. Brief Bioinform 21:1047–1057.
[Crossref] [Googlescholar][Indexed]
- Liu B, Liu F, Wang X, Chen J, Fang L, et al. (2015) Pse-in-One: a web server for generating various modes of pseudo components of DNA, RNA, and protein sequences. Nucleic Acids Res 43:W65–W71.
[Crossref] [Googlescholar][Indexed]
- Wang J, Zhang L, Jia L, Ren Y, Yu G (2017) Protein-Protein Interactions Prediction Using a Novel Local Conjoint Triad Descriptor of Amino Acid Sequences. Int J Mol Sci 18:2373.
- Nanni L (2005) Hyperplanes for predicting protein–protein interactions. Neurocomputing 69:257–263.
- Chen Z, Zhao P, Li F, Leier A, Marquez-Lago TT, et al. (2018) iFeature: a Python package and web server for features extraction and selection from protein and peptide sequences. Bioinformatics 34:2499–2502.
- Xia JF, Han K, Huang DS (2009) Sequence-Based Prediction of Protein-Protein Interactions by Means of Rotation Forest and Autocorrelation Descriptor. Protein Pept Lett 17:137–145.
[Crossref][Googlescholar] [Indexed]