Research Article, Geoinfor Geostat An Overview Vol: 11 Issue: 5
Classification of Land-Use/Land-Cover in Kaduna Metropolis, Kaduna State, Nigeria
Nantip Thomas Goselle*, Obot Akpan Ibanga and Peter AO Odjugo
Department of Geography and Regional Planning, University of Benin, Benin, Nigeria
- *Corresponding Author:
- Nantip Thomas Goselle
Department of Geography and Regional Planning,
University of Benin,
Benin,
Nigeria;
E-mail: tipsgeee@gmail.com
Received date: 03 May, 2023, Manuscript No. GIGS-23-97627;
Editor assigned date: 05 May, 2023, PreQC No. GIGS-23-97627 (PQ);
Reviewed date: 19 May, 2023, QC No. GIGS-23-97627;
Revised date: 03 July, 2023, Manuscript No. GIGS-23-97627 (R);
Published date: 10 July, 2023, DOI: 10.4172/2327-4581.1000353
Citation: Goselle NT, Ibanga OA, Odjugo PAO (2023) Classification of Land-Use/Land-Cover in Kaduna Metropolis, Kaduna State, Nigeria. Geoinfor Geostat: An Overview 11:5.
Abstract
This study aimed at classifying the various land use/land cover in the Kaduna metropolis of Nigeria. This study relied primarily on remotely sensed data which were acquired using landsat 5 thematic mapper, landsat 7 enhanced thematic mapper and landsat 8 operational land imager thermal infrared sensors for 1990, 2001, 2010 and 2018. Forest, grass/sparse vegetation, water and built-up/bare surfaces were the four land-use/land-cover types classified. The overall image classification accuracy of the land use and land cover was 95% for 2018 image with Kappa Coefficients (KC) of 0.96, 91% (KC=0.89) for 2010, 89% (KC=0.96) for 2001 and 91% (KC=0.91) for 1990. The fact that both the overall Image Classification Accuracy (ICA) and Kappa Coefficients (KC) were above 85% and 0.85 showed that all the remotely-sense products were satisfactorily classified. A gradual increase in built up/bare surface land use/land cover class from 5.38% of Kaduna metropolis in 1990 to 15.12% in 2018 and a decline in forest land use/land cover class from 76.08% in 1990 to 47.88% in 2018. This understanding of the dynamics observed in the land use/land cover pattern can be instrumental in reducing the negative effects of urban infrastructure development and practices on the climate of the Kaduna metropolis with improve legislative approach, thereby improving living conditions.
Keywords: Classes; Land use; Land cover; Kaduna metropolis; Landsat TM
Introduction
The population of the world is increasing rapidly Williams, et al., and it is becoming more and more urbanized with the largest and fastest growth in the world’s populations taking place after 1950 urbanization rose from 30% in 1950 to 56% in 2020. The 56% world’s urban population (4.4 billion) still holds sway for 2022 [1].
Studies have shown that there is a phenomenal increase in the proportion of Nigerians living in urban areas thus far. Enisan, et al. reported that 7% and 10% of Nigerians were domiciled in the few identified urban centers in the 1930 to 1950 respectively, 20%, 27% and 35% were urban dweller in the years 1970, 1980 and 1990 respectively. In late 2000’s, above 40% of Nigerians were found to dwell in urban centers of different sizes. In 2018, Nigeria had an urban population of 50.3% Knoema, et al. which then grew to 51.9 % (which is a total of 104,282,822 people) in 2019 [2]. While in 2022, 53.5 % (116,919,548 people) of the 218,541,212 Nigeria populations are urban dwellers [3].
Such increase in the demographic configurations has the tendency of triggering alterations in the urban environment. The traditional physical characteristic of the landscape is altered by urban development through the introduction of anthropogenic (man-made) structures. The structures introduced by man replace vegetation cover in the environment and increases impermeable surface area which also amplifies capacities for the storage of heat [4]. Most part of the urban landscape is made of hard, high heat-absorbing materials with low albedo and is relatively devoid of vegetation. Also, the city morphology (urban canyons) increases the capacity of the urban areas to trap radiant heat and slow down the flow of cooling winds [5].
The primary driver of the urban heat island is the land cover land use, notably loss of canopy/vegetation cover resulting from urbanization. While land use could be seen as the utilization of the land which is the direct impact of human activities and land surface processes in forms of built up, water bodies and vegetation [6]. Land cover on the other hand is heterogeneous which is the physical and biological cover over the land surface. Land cover encompasses the physical materials over the earth which includes water bodies, asphalt, vegetation cover, and other artificial or man-made structures [7,8]. When the social and economic utility, particularly as it relates to ownership and management of land as an important earth resource, land use entails the surface utilization of a vacant or developed land for a clear purpose at a given time. Unbalanced management of land use can lead to socio-economic changes that can generate structural heterogeneity to the advantage of the urban dwellers as against their rural neighbors and can also lead to land use environmental conflicts [9].
Land cover can be observed directly through the use of remote sensing tool. Despite similarity in land cover, land use may be different. There is a very strong positive relationship between urbanization and Urban Heat Island. The land use of the urban area alters the land cover from the naturally occurring land cover to conform to the anthropogenic induced land use type [10-14]. This in turn can alter the atmospheric temperature of the urban environment making it hotter than the nearby rural area leading to a phenomenon earlier referred to as urban heat Island. When the heat island areas are determined using remotely sensed satellite images, it can be compared with ground based synoptic data and the outcome used for informed decision. Thus, understanding the dynamics of urban heat Island in a city has the potential to help in reducing the negative effects of urban infrastructure development and practices thereby improving living conditions. There is therefore, the need to investigate how land use/ land cover dynamics interact with surface temperature thereby creating an altered climatic regime with particular reference to Kaduna metropolis. The aim of this study is to examine the various classes of land use/land cover in Kaduna Metropolis, Kaduna state, Nigeria [15].
Materials and Methods
Study area
Kaduna metropolis is located within Kaduna state of Nigeria. Kaduna state is situated between latitude 09°02' to 11°32' and between longitude 06°15' to 08°38'. The state is bounded by Abuja (FCT) and Niger state at the South-West, Katsina state, and Zamfara state at the North-West, Kano state and Bauchi state at the North-East, Plateau state and Nasarawa state at the South-East. Generally, it occupies the total area of 70,233 sq.km. Kaduna metropolis forms the capital city of Kaduna state which is located in the Northern Guinea Savannah zone of Nigeria. It lies between latitudes 10°24'39"N and 10° 36'40"N and longitudes 7°21'26"E to 7°30'3"E at an altitude of 645 m above sea level [16].
Rainfall is heavier in the southern and eastern parts but decreases northwards towards Katsina and Westwards in the direction of Kontangora. Throughout the state, there is only a single rainfall peak which comes in August or September. The rainy season is longer in the south and east where it begins in April and ends in October. Rainfall is lower in the northern part of the state and lasts from mid-May to October. The Southern Kaduna towns like Kafanchan and Kagoro, with mean annual rainfall of over 1,524 mm, compared to towns like Makarfi and Ikara in the northern part, with mean rainfall of 1,016 mm. Generally, the mean yearly rainfall is 1,272.5 mm, and the yearly humidity of Kaduna state is 56.64 percent. The highest average temperature and lowest temperature of 28.9℃ and 22.9℃ occurs in April and December respectively. The climatic characteristics of the Kaduna is also affected positively by the orographic effects of the Jos-Plateau and the Kagoro Hills posing its effect on the precipitation (ppt), the relative humidity and temperature patterns. Kaduna is experiencing increasing temperature which is an atmospheric condition indicating increasing warming of the earth’s atmosphere.
The study area is underlain by the basement complex geology of central Nigeria. It is composed of metamorphosed gneiss of the older high grade intermixed by young meta-sedimentary belt of mainly quartzite and schist. Also, the base is characterized by older granitic crystalline, metamorphic rocks of Precambrian to low Paleozoic era. Gneisses born out of intense weathering but stable for several millions of years can also be found. More so, rolling plains dotted with residuals of different origin have been produced from prolonged weathering under tropical bioclimatic condition [17].
The soil of Kaduna state is predominantly the ferruginous. Vegetation zones in Kaduna state follows a strong east west marking but are often modified at both large and small scales by distinct geologies and landforms. Here the great influence of rainfall on vegetation and soil is obvious as vegetation divided into two which are, northward by northern Guinea Savannah and southward by southern Guinea Savannah [18]. The Savannah vegetation is characterized by grasses inter mixed with trees and occurring at varying locations. These grasslands appear as product of man’s prolonged exploitation of the wooded lands rather than a “naturally”, occurring phenomenon. The Southern part, with higher rainfall is comprised of Savannah wooded lands with trees of about 20-40 ft, e.g, and shear butter. The drier part, comprises of lower orchard shrub with scattered trees like the baobab, silk cotton, among others [19].
Kaduna river is the major drainage system in Kaduna metropolis and indeed in the entire Kaduna state. River Kaduna is the main tributary of Niger River in central Nigeria. It rises on the Jos plateau south west of Jos town in a North West direction to the north east of Kaduna town. It then follows a south westerly and southerly course before completing its flow to the Niger River. Most of its course passes through open savanna woodlands but its lower section cut several gorges including the granite ravine at Shiroro above its entrance into the extensive Niger flood plains [20]. The river Kaduna divides the metropolis into two major areas, namely, Kaduna North and Kaduna South. In the Northern part of the divide is mostly found the commercial centers and residential areas while the South is the industrial area. The river impacts on the microclimate of Kaduna metropolis where its major tributaries drain.
In 2006, the population of Kaduna state stood at 6,113,503 and with the growth rate of 3.18%, it grew to 8,103,075 in 2015, 8,446,417 in 2018 and 9,476,053 at the end of 2020 making it the third highly populated state in Nigeria. Fifty percent of the Kaduna state population lives in urban (Kaduna metropolis) or semi-urban (Kafanchan) centers etc. The population indices reveal that the state is characterized by 22% infants’ population (0-5 years old) and 18% children’s population (6-11 years old). The life expectancy rate in Kaduna state at birth for the male is at 43 while for the female is at 48. There is increasing pressure on the urban resources and infrastructure owing to the relatively high number of the people that are living in the urban and semi-urban centers in the state. The river Kaduna floodplain have eventually been transformed into urbanized lands leading to the conversion of viable agricultural lands to built-up land because of the pressure posed by rise in urban populace and demand for lands for residential and other purposes is having on the city. Explosive population increase, urban growth and development, security reasons, employment opportunity, proximity to places of work, private procurement of lands for construction of houses and commercial centers, reclaiming of lands by government for public interest etc. are primarily responsible for the land use changes prevalent in Kaduna.
Kaduna state economy is said to be small with little diversification which leads to high unemployment and poverty. Farming is the predominant occupation of the people of Kaduna. They produce both cash and food crops in large quantities for domestic consumption and export within Nigeria. Their common farm produce are maize, yam, millet, rice, tobacco, beans, guinea corn, ginger, groundnut, sugar cane, tomatoes, pepper and even cassava. The state has high potential for livestock and fisheries which can be promoted to increase the contribution to the gross domestic product. Farmers in Kaduna are involved in predominantly rainy season farming with a minute percentage of the people practicing dry season (irrigation) farming.
Arable crops cultivated during dry season farming include tomatoes and other perishable goods and vegetables. This system of farming is majorly practiced around the Kaduna river and its tributaries serving the purpose of water supply for irrigation purpose. Kaduna has been known to be an ancient center of administration which served as the old Northern protectorate in 1931 and also for the post-independence Northern region. Railways and developed road network positioned Kaduna as a significant trade center and a key transportation nucleus servicing the surrounding agrarian communities. Industries, banks, educational institutions and other government investments. Are also situated in Kaduna.
Research design
Data collection and analytic techniques: This research relied on the use of secondary data which was categorized into remotely sensed and non-remotely sensed. The remotely sensed dataset was landsat imageries comprising landsat 5 thematic mapper (landsat TM), landsat 7 Enhanced Thematic Mapper (7 ETM+) and Landsat 8 Operational Land Imager Thermal Infrared Sensor (OLI_TIRS) data for 1990, 2001, 2010 and 2018. They were sourced from the United States geological Surveys website. Landsat imageries were chosen based on the fact that its moderate spatial (30 meters) and temporal (16 days) resolution sufficed for the study.
These datasets were used in derivation of land use/cover and land surface temperature for the purpose of classifying LULC. The detail of the Landsat data used in this study is presented in Table 1.
| Date | Type of image | Landsat no. | Month of acquisition | Spatial resolution | No. of bands (o) | Sun elevation | Sun azimuth |
|---|---|---|---|---|---|---|---|
| 1990 | TM | 5 | December | 28.5 | 7 | 45.18 | 127.4 |
| 2001 | TM | 5 | December | 28.5 | 7 | 53.41 | 138.82 |
| 2010 | ETM | 7 | November | 28.5 | 8 | 48.92 | 134.09 |
| 2018 | OLI_TIRS | 8 | December | 30 | 10 | 57.84 | 140.72 |
Table 1: Summed up characteristics of the utilized satellite images.
The rationale for deploying this dataset is not unconnected to the prime motivation of this study being classification of LULC of Kaduna Metropolis. Current research used ground measurements of air temperature from NiMet to analyze the temporal character of temperature in Kaduna metropolis. On the other hand, remotely sensed Landsat derived land surface (skin) temperature was used for the analysis of the spatial pattern of thermal conditions in Kaduna urban areas.
ArcGIS desktop versions (ArcGIS 10.7, ArcGIS Pro 2.5), XLSTAT and Minitab statistical software plus the Microsoft office 2016 (word and excel) were used in the data extraction, analysis, and presentation in the present study. Specifically, ArcGIS desktop software was used for image and spatial data processing, analysis and generation of the relevant maps and models. Microsoft office 2007 (word and excel), Minitab, XLSTAT were used for statistical analysis and reporting.
Since the Landsat imageries used in the current study came in different bands, each epoch (1990, 2001, 2010 and 2018) was layer stacked to form single composite imagery using layer stacking algorithm in Erdas imagine 9.2 Software. In other to carve out the Area of Interest (AOI) which is Kaduna Metropolis, AOI algorithm was deployed in the creation of AOI from the four composite imageries. The created AOI layers then served as input data for the sub setting of the four composite imageries using clip raster tool in ArcGIS desktop version (ArcGIS 10.7).
GIS based digital image classification was deployed in order to achieve the objectives which centered on examination of the various classes of land use/land cover in Kaduna metropolis (1990-2018). A number of classification frameworks are available in literature and based on wide applications in studies of this nature, a blend of the two methods namely: Supervised and unsupervised image classification techniques were adopted.
Training samples (spectral signatures) of each land cover type of interest was digitized onscreen. Each land cover type was digitized using polygons of different sizes (containing different number of pixels) at different spots in the study area and these were later aggregated to one training sample for each land cover type. Land cover used in this study was classified into four main categories, namely, built-up/bare surfaces, water, grass/sparse vegetation, and forest/bush (Table 2).
| Land use class | Description |
|---|---|
| Built up/bare surfaces | Made up of high density urban areas usually having industrial edifices with large open roofs, and well-developed transport systems such as airfields, car parks spaces, and multi-lane express/highways. This also includes single/multiple family houses, housing estate for public and local roads. Bare surfaces include bare soil, rock outcrops, and asphalted surfaces and all natural and man-made are surfaces directly exposed to sunlight. |
| Grasses/sparse vegetation | Land cover types with grasses, usually covered with short and scattered tress but allows a reasonable amount of thermal energy to be absorbed by the underlying natural surface. This includes scrubland, grasses, and all sparsely vegetated surfaces. |
| Forest/bushes | Areas typically consisting of large and tall trees forming a vegetation canopy with thorns and thick grasses covering the lower canopy layer. The vegetation is typically dense and compact thereby allowing little penetration of sun light into the lower canopy of the ecosystem. |
| Waterbody | Consists of all spaces of open water including watercourses, inland waterway, ponds, rivers etc. |
Table 2: Land use/land cover classification scheme.
Classification accuracy assessment for the image was also carried out with about 100 randomly distributed ground truth points within the limit of the study area. The generated points were based on stratified random sampling type and stratification was proportionate across all classes. These points were used to compute the confusion or Error Matrix (EM) for the classified landsat imagery, based on Kappa coefficient with which the outcomes of each classification for each year were compared. This was done by using the validation classified areas earlier discussed. An error matrix is used to compare the classified pixels in the classified image to a reference authentication dataset in this case a high-resolution image.
Error matrix table was generated with pixel counts organized in categories of rightly classed or incorrectly classed the classification does address the number or amount of rightly classed pixels as well as those that are wrongly classified and their specific classes. As such, it became possible to appreciate the probability of any systematic error in the classification. Though the overall accuracy is 100 percent but Campbell, et al. upheld that a total accuracy of 80% and above calculated in the error matrix can be referred to as good. Calculating the producer and user accuracy was made possible by the error matrix. A division of the rightly classed pixels with that of the total classed pixels for every category gives the producer and user accuracy. The percentage of over and under classification is also determined here. The sum of rightly classified pixels is the overall accuracy.
The accuracy information helps in unveiling the extent to which the dataset relates to the validation data. The kappa coefficient can be calculated for further analysis of such agreement. The kappa coefficient is centered on chance agreement, between the datasets and the overall accuracy. This is pertinent in aiding the understanding of whether the agreement that exist between the classification dataset and the validation dataset are due to chance alone. Kappa aids an improved appreciation of our classification scheme and aids to reveal if the results were achieved better than it would have been achieved if we go strictly by chance. Kappa is computed using the mathematical expression presented in equation 1 as follows:
(Observed-Expected)/(1-Expected) (1)
However, where observed is equal to overall accuracy and the expected is calculated from the total for rows and total for columns. The overall accuracy based on chance was calculated using the mathematical expression presented in equation 2.
Product matrix/Cumulative sum of product matrix (2)
Results and Discussion
Land use/land cover classes between 1990-2018 in Kaduna metropolis
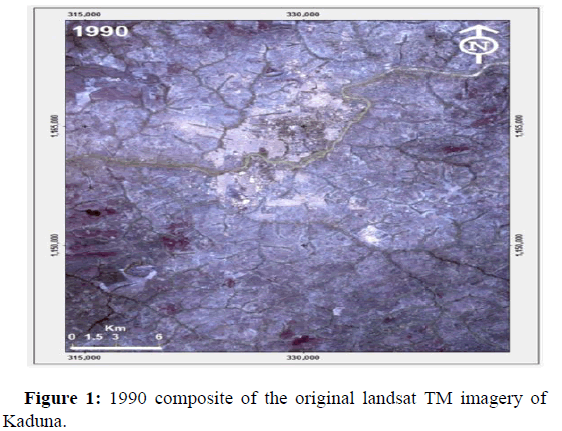
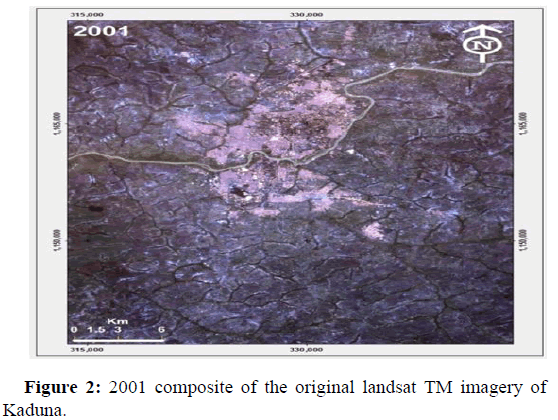
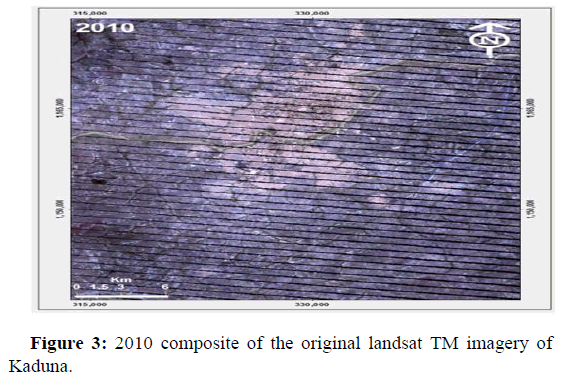
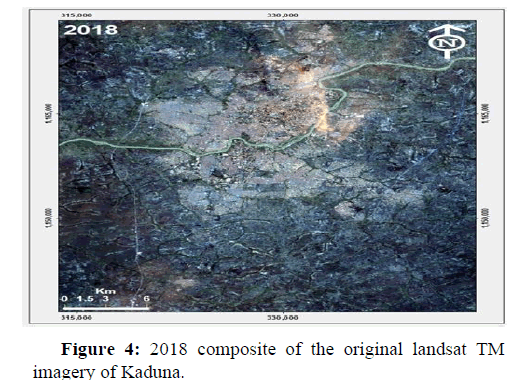
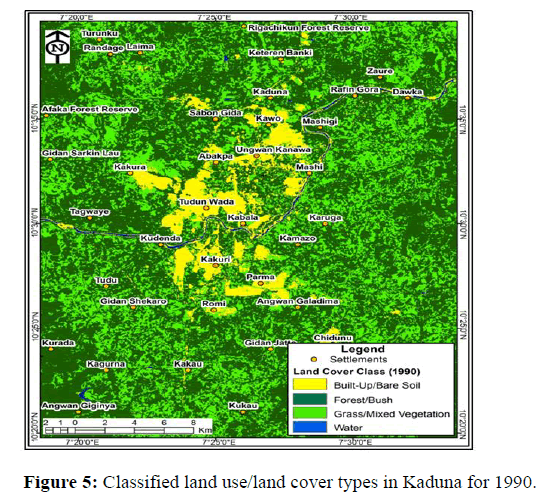
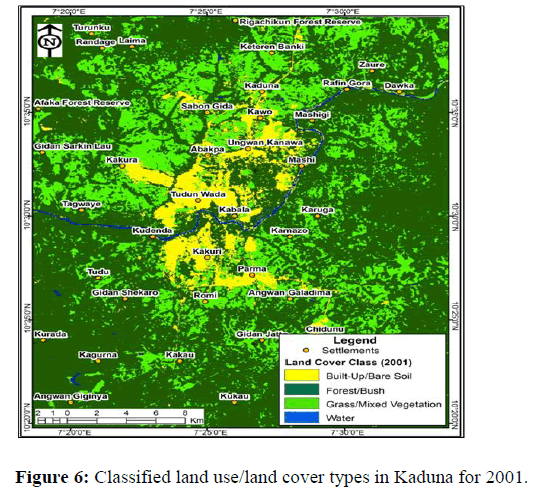
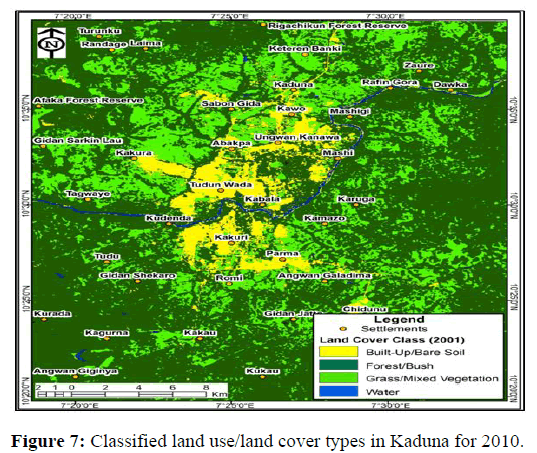
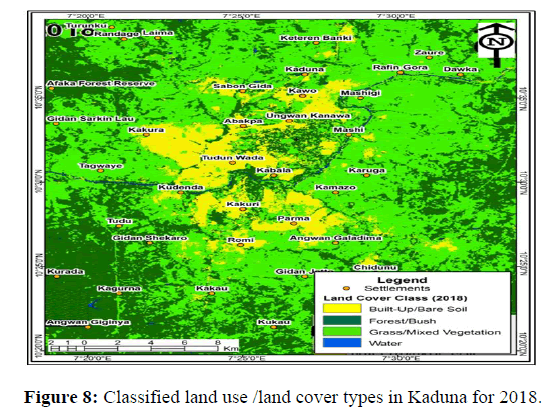
This study identified four (4) land use and land cover categories each from Landsat imageries of Kaduna metropolis in 1990, 2001, 2010 and 2018 namely: Forest, grass/sparse vegetation, water and built-up/bare surfaces (Figures 1-4).
The overall image classification accuracy of the land use and land cover as shown in Table 3 was 95% for 2018 image with Kappa Coefficients (KC) of 0.96, 91% (KC=0.89) for 2010, 89% (KC=0.96) for 2001 and 91% (KC=0.91) for 1990. Similarly, the results of the classified land use/land cover classes of Kaduna metropolis in 1990, 2001, 2010 and 2018 is presented in Figures 5-8.
| Year | User accuracy (%) | Producer accuracy (%) | Total accuracy | Kappa coefficient | ||||||
|---|---|---|---|---|---|---|---|---|---|---|
| Water | Forest | Built-up/bare soil | Grass/mixed vegetation | Water | Forest | Built-up/bare soil | Grass/mixed vegetation | |||
| 2018 | 100 | 90 | 100 | 79 | 100 | 90 | 91 | 83 | 95 | 0.96 |
| 2010 | 99 | 91 | 98 | 81 | 98 | 93 | 90 | 80 | 91 | 0.89 |
| 2001 | 100 | 95 | 92 | 89 | 100 | 91 | 95 | 84 | 89 | 0.96 |
| 1990 | 100 | 88 | 91 | 91 | 95 | 89 | 91 | 85 | 91 | 0.91 |
Table 3: Summary of accuracy assessment (confusion matrix) of the classified land cover types in Kaduna metropolis (1990, 2001, 2010 and 2018).
Land use/land cover classes between 1990-2018 in Kaduna metropolis
In evaluating land use/land cover classes of any location, the validity of the classification scheme, to a large extent depends on the user accuracy and producer accuracy. Forest, grass/sparse vegetation, water and built-up/bare surfaces were the four (4) land use/land cover classes of land use/land cover that were classified using the landsat TM 1990, 2001, 2010 and 2018 imageries. The fact that both the overall Image Classification Accuracy (ICA) and Kappa Coefficients (KC) were above 85% and 0.85 showed that all the remotely-sense products were satisfactorily classified. That is to say about 5% for 2018, 9% for 2010, 11% for 2001 and 9% for 1990 of all reference pixels did not match the actual land use/land cover they represent.
The classification accuracy obtained in this study were actually higher than the 80% (ICA) and 0.8 (KC) recommended by Campbell, et al. and the ICA of 81.38% (KC of 78.77%) from the classified 2016 Landsat imagery of Kendari city, Southeast Sulawesi province, Indonesia as reported by Surya, et al.; Jande, et al. also reported ICA of 80.77% (1987), 85.84% (2007) and 86.24% (2017) imageries of Gboko LGA of Benue state which were actually below the values obtained in this study. The finding is also close to ICA of 98.67% and KC of 0.9805 for the 1987 imagery of Kaduna South LGA, Kaduna state classified by Ezeamaka, et al.
However, among the four classified land use/cover classes, the classification performed best for water and the built-up/bare soil land cover classes but less so for forest and grass/mixed vegetation. Certain trends are clearly distinguishable from the classified land cover classes. Generally, built-up/bare surfaces land cover type continuously increased in extent throughout the period under study, from 5% in 1990 to 15% in 2018, accounting for the land cover with the highest percentage increase in the metropolis within the period. The observed increase in built-up spaces in the metropolis could be attributed to the natural physical urban growth within this period which comes with construction of more buildings and urban infrastructure. Previous studies estimating urban growth pattern in Kaduna metropolis such as Akpu, et al. confirms that the built-up space in Kaduna metropolis increased from 28% to 55% from 1990-2001 to 2001-2009 respectively.
The exact factors driving the observed urban expansion may not be unconnected to rural-urban drift and the quest for wealthier people in rural areas to own properties in the capital city and similar trend was sustained up till 2010 to 2018 periods. Besides, the forest land cover was the most dominant land cover type in the study area for all the years considered. Forest land cover was 76% in 1990 but gradually declined to 47% in 2010 and slightly increased to 48% in 2018. Grass/ sparse vegetation was the second most dominant land cover type after forest land cover for all the years considered in the current study. The finding also showed that grass/sparse vegetation increased from 18% in 1990 to 43% in 2010 and declined to 36% in 2018. This is in consonance with the study carried out by Ezeamaka, et al. and that of Abubakar, et al. carried out much later. This phenomenon may not be unconnected to public awareness and the urban greening exercise of the state.
Generally, urban expansion leads to conversion of forest/grass land cover types into built-up space. The observed trend in the land cover types reflected a typical trajectory of urbanization which, in the first phase, leads to the conversion of the forest land cover to grass/sparse vegetation as a result of evolving pockets of urban structures and farming while the grassland gradually becomes fully built-up and thus matures into a developed area. For instance, Akpu, et al. reported a phenomenal increase in built-up areas in Kaduna metropolis between 1990-2009 which coincided with the period the current study exhibited a sharp reduction in the forest land cover. This observed dynamics in the land cover types in the study area also followed the development pattern in the metropolis where expansion in the urban area generally resulted in reduction in the forest/grass land cover component in the area.
Moreover, the water land covers class in this study remained almost constant in spatial extent for all the years considered but with a gentle fluctuation. The water land cover is primarily the River Kaduna and its tributaries. In 1990, the water land cover represented 0.6% of the total LULC. It fluctuated from 0.6% in 1990 to 0.4% in 2001 and up again to 0.5% in 2010 and rose to 1% in 2018. Fluctuation in water land cover may have resulted from instabilities in the hydrological situation within the years where river banks can swell due to higher rainfall amount and sedimentation occur during periods of reduced rainfall and high rate of evaporation.
Generally, land cover land use changes are driven by a combination of physical, socio-economic, political, and institutional factors. Spatially, River Kaduna splits the Kaduna metropolis into approximately two equal halves in the North-South directions. Although, the river constitutes not more than 1% of the total land cover class within the period of interest in the current research, it is a main feature in the Kaduna metropolis.
Nevertheless, key notable result from the land-use/land-cover classification in Kaduna Metropolis was a gradual but sustained increase in urban/built-up surfaces. Urban landscape increased from 5% in 1990 to 15% in 2018, representing an increase of about 200% and this corresponds to a reduction in forest land cover. This change could be attributed to natural urban growth and expansion as also reported by Ezeamaka, et al. indicating that land conversion was significant in the Kaduna metropolis. Following a typical urbanization pattern where urban infrastructure displaces vegetated/forest areas Sarkar, et al. the physical urban expansion in Kaduna resulted in the depletion of existing arable lands, vegetated areas such as grasses/ sparse vegetation and the forested spaces. This finding corroborates that of Jande, et al., who alluded that continuous urban growth with no sign of reduction in the near future will certainly expose the surrounding vegetation and land use/land cover to various levels of vulnerabilities among whom are wildlife and biodiversity extinction which can eventually lead to climate modification.
Conclusion
This research aimed at classifying the various land use/land cover in Kaduna city, Nigeria. which resulted in the following findings: Four (4) categories of land use/land cover were classified with overall Image Classification Accuracy (ICA) of 95% and Kappa Coefficients (KC) of 0.96 for 1990, ICA of 91% (KC=0.89) for 2001, ICA of 89% (KC=0.96) for 2010 and ICA of 91% (KC=0.9) for 2018 imageries. Built-up/bare soil land use/land cover class covered 5.38% of Kaduna metropolis in 1990, 5.26% in 2001, 9.03% in 2010 and 15.12% in 2018. In 1990, grass/mixed vegetation land use/land cover class occupied 18% of the study area, 27.32% in 2001, 35.99% in 2010 and 35.99% in 2018. Also, forest land use/ land cover class spanned across 76.08% in 1990, 66.98% in 2001, 47.06% in 2010 and 47.88% in 2018. On the other hand, Water land use/land cover class covered 0.6% of the study area in 1990, 0.44% in 2001, 0.50% in 2010 and 1.01% in 2018. Continuous researching is encouraged.
References
- Abaje IB, Oladipo EO (2019) Recent changes in the temperature and rainfall conditions over Kaduna State, Nigeria. Ghana J Geogr. 11:127-157.
- Abaje IB, Achiebo PJ, Matazu MB (2018) Spatio‐temporal analysis of rainfall distribution in Kaduna state, Nigeria. Ghana J Geogr 10:1-21.
- Abaje IB, Ishaya S, Usman SU (2010) An analysis of rainfall trends in Kafanchan, Kaduna state, Nigeria. Res J Environ Earth Sci 2:89-96.
- Abubakar BA, Abubakar SA (2022) Effects of urban vegetation in mitigating Land Surface Temperature (LST) in Kaduna metropolis, Nigeria. Inter Geoinfor Days 4:184-187.
- Akpu B, Tanko A, Jeb D, Dogo B (2017) Geospatial analysis of urban expansion and its impact on vegetation cover in Kaduna metropolis, Nigeria. Asian J Environ Ecol 3:1-11.
- Al-Amin MA, Dadan-Garba A (2014) Urban vegetation study of Kaduna metropolis using GIS and remotely sensed data. J Nat Sci Res 4:163-171.
- Azadi H, Vanhaute E (2019) Mutual effects of land distribution and economic development: Evidence from Asia, Africa, and Latin America. Land 8:96.
- Bununu YA, Ludin AN, Hosni N (2015) City profile: Kaduna. Cities 49:53-65.
- Daful MG, Adewuyi TO, Muhammad MN, Oluwole OA, Dadan-Garba A, et al. (2020) Assessment of the spatial relationship between air pollutants in Kaduna Metropolis, Nigeria. J Sustain Dev 13:204-223.
- Daudu CK, Yarama N, Issa FO, Fatunbi AO (2020) Mechanization and skill development for productivity growth, employment and value addition. Insights Nigeria 1-5.
- Enisan G (2017) Effect of accommodation pressure on housing affordability in Ikeja, Lagos, Nigeria. FUTY J Envir 11:64-75.
- Ezeamaka CK, Daful MG, Umeano EC (2019) Land use and land cover analysis of Kaduna South local government area, Kaduna state, Nigeria. Am J Environ Prot 8:62.
- Haruna MS, Bawa YB, Francis E (2020) Society for Family Health (SFH) and reproductive health services in Chikun LGA of Kaduna State, Nigeria. Lapai Int J Admin 3:45-59.
- Ishaya Abaje IB (2008) Indigenous people’s perception on climate change and adaptation strategies in Jema’a local government area of Kaduna state, Nigeria. J Geogr Reg Plann 1:138-143.
- Jande JA, Nsofor GN, Abdulkadir A (2019) Assessment of land use and land cover changes and urban expansion using remote sensing and GIS in Gboko, Benue state, Nigeria. J Res For Wildl Envir 11:201-214.
- Okpalike C, Okeke FO, Ezema EC, Oforji PI, Igwe AE (2022) Effects of renovation on ventilation and energy saving in residential building. Civ Eng J 7:124-134.
- Olagunju OE, Ariyo OC, Emeghara UU, Olagunju OS, Olafemi SO (2020) Determinants of farmer’s attitude to plant agro forestry trees in Kaduna state, Nigeria. Adv Res 21:155-166.
- Provost LP (2011) Analytical studies: A framework for quality improvement design and analysis. BMJ Qual Saf 20:92- 96.
- Sarkar A (2018) Accuracy assessment and analysis of land use land cover change using geoinformatics technique in Raniganj coalfield area, India. Int J Environ Sci Nat Res 11:25-34.
- Viera AJ, Garrett JM (2005) Understanding interobserver agreement: The kappa statistic. Fam Med 37:360-363.
[Google Scholar] [PubMed]
 Spanish
  Chinese
  Russian
  German
  French
  Japanese
  Portuguese
  Hindi
Hindi 