Research Article, Geoinfor Geostat An Overview Vol: 12 Issue: 6
A Comparison of the Epikarst of Karst Areas by the Statistical Study of their Resistivity
Marton Veress* and Gyorgy Deak
1Department of Geography, Savaria University Centre, Eötvös Lóránd University, Szombathely, Hungary
*Corresponding Author: Marton Veress
Department of Geography, Savaria University
centre, Eötvös Lóránd University, Szombathely, Hungary
E-mail: veress.marton@sek.elte.hu
Received date: 18 October, 2024, Manuscript No. GIGS-24-150345;
Editor Assigned date: 22 October, 2024, PreQC No. GIGS-24-150345 (PQ);
Reviewed date: 05 November, 2024, QC No. GIGS-24-150345;
Revised date: 12 November, 2024, Manuscript No. GIGS-24-150345 (R);
Published date: 19 November, 2024, DOI: 10 .4172/2327-4581.1000420.
Citation: Veress M, Deak G (2024) A Comparison of the Epikarst of Karst Areas by the Statistical Study of their ResistivityA Comparison of the Epikarst of Karst Areas by the Statistical Study of their Resistivity. Geoinfor Geostat An Overview.12:6.
Abstract
The epikarst of some karst sample sites were compared. For this the significance of bedrock resistivity values that were obtained by Vertical Electrical Sounding (VES) were determined by t-test. The mean values and standard deviation along the profiles of VES measurement sites were calculated and graphically described. It can be established that the epikarst of profiles with high resistivity mean values is thicker and the epikarst is of heterogeneous cavity formation at sites where the standard deviation of resistivities is high. The epikarst of some karst sample sites can be compared by their standard deviation fields. At sites where the standard deviation fields overlap each other, their epikarsts are similar, at those where they do not overlap each other, they are different from each other and at sites where they touch, their similarity is transitional. In the latter cases, those with higher mean values and higher standard deviation have more cavities and their cavity formation is more heterogeneous. The epikarst with these characteristic features is regarded as more mature. The reliability of comparisons is shown by the fact that those with a more mature epikarst are karstified to a larger degree.
Keywords: Epikarst; Resistivity; T-test; Arithmetic mean; Standard deviation
Introduction
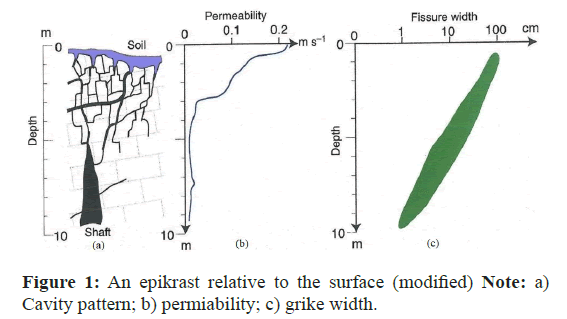
In this study, the degree of cavity formation in the epikarst of karst rocks is compared by the statistical analysis of resistivities. The epikarst consists of karren and cavities closely connecting to them [1-3]. After the infiltrating waters become saturated, above the saturation level, where dissolution still operates, secondary porosity, which represents solution cavities in the rock, is 10%-20%, while this value is at most 2% below it, in the vadose zone [4,5]. Its thickness depends on several factors, but mostly it is 10 m-30 m [5-7].
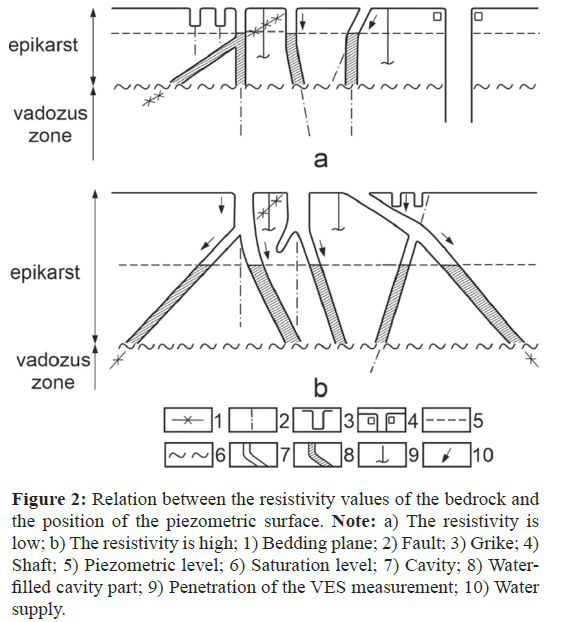
As a result of the abrupt decrease of porosity, the infiltrating waters back up and penetrate laterally [8]. The level of the backwater is the piezometric level, the level of which may be at various depth and may fluctuate due to several reasons [9-11]. Its different depth can be caused by the different degree of cavity formation and cavity frequency (total volume of cavities), while its fluctuation may be caused by water supply of different intensity (precipitation intensity, different degree of water supply originating from superficial deposits). The characteristics of the epikarst are described (Figures 1and 2).
Figure 2: Relation between the resistivity values of the bedrock and the position of the piezometric surface. Note: a) The resistivity is low; b) The resistivity is high; 1) Bedding plane; 2) Fault; 3) Grike; 4) Shaft; 5) Piezometric level; 6) Saturation level; 7) Cavity; 8) Waterfilled cavity part; 9) Penetration of the VES measurement; 10) Water supply.
If the resistivities of various karst areas and some of their parts are compared, the degree of cavity formation in the epikarst will also be well-comparable. It is important to obtain a better knowledge of the degree of cavity formation because the epikarst controls surface feature development. However, the cavity formation of the karstic rock can rarely be observed (for example when the karstic rock is dissected), but even in the case of dissection, the degree of cavity formation (for example the total volume of cavities, the degree to which the cavities are filled, etc.) could only be determined by long-lasting measurements.
The peculiar landscape (closed, areic features) of karst areas can be attributed to the fact that the dissolved rock material is transported inside the rock. However, surface feature development is affected by the cavernous part (its density, size and distribution) of the epikarst that was formed by dissolution.
Among surface karst features, the most common are the solution dolines of soil-covered karst (mainly drawdown dolines), on covered karst, subsidence dolines such as suffusion dolines, dropout dolines and compaction dolines, etc. [3,12-14]. Solution dolines are formed in the karstic bedrock, while subsidence dolines develop in the cover [15-17]. Below drawdown dolines the epikarst is mature whose cavity formation is heterogeneous [5,18]. But below subsidence dolines, it is immature and separated into parts by shafts [11,19].
Materials and Methods
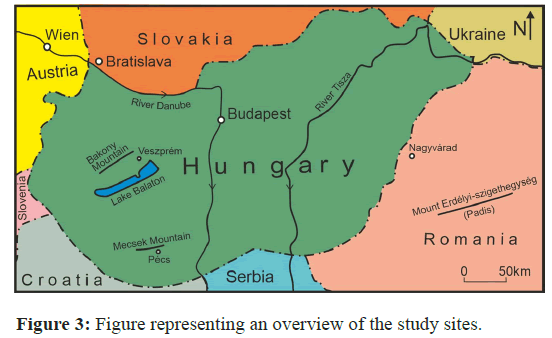
The VES measurement data of this study were obtained from three karst areas: The Bakony Mountains (Transdanubian Mountains, Hungary), the Western Mecsek Karst (Mecsek Mountains, Hungary) and Pádis (Bihar Mountains, Romania) (Figure 3).
Research areas
The Bakony Mountains are low (below 700 m) middle mountains. Here, VES measurements were made in the eastern part of Tés Plateau, in the Homód Valley, on Mester Hajag and in the area of the Eleven Fortes doline group (Figure 4). The listed areas are covered karsts [20]. In the eastern part of Tés Plateau (with an altitude of 400 m-500 m), mainly on valley floors, suffusion dolines developed in high numbers and large size, 17 dolines (their density is 0.25 doline/100 m2 in one of the tributary valleys of Tábla valley and in its environs). Here, the bedrock is Jurassic limestone, the superficial deposit is loess, clay, sand and clay with limestone debris. In the Homod Valley (its altitude is 440 m-460 m), suffosion dolines were formed on loess, loessy clay and clayey limestone debris, on the floor of an epigenetic valley. Its bedrock is Eocene limestone. Here, the dolines are situated in two small patches, where the number of dolines is relatively high, 22, the density of dolines is 0.12 doline/100 m2 at the more northern group and large dolines also occur among them. Suffosion dolines which were already fossilized are also common here. The Mester-Hajag is constituted by a plateau-like block (its elevation is 450m-500 m). The number of small suffosion dolines is low, it is 10 (their density is 0.03 doline/100 m2) and they occur between exposed limestone mounds, on loessy, clayey surfaces and on surfaces covered by limestone debris. Its bedrock is Cretaceous limestone. The Eleven-Fortés doline group (its altitude is 670 m-680m) is on the block of Koris Mount. The doline group is in a paleokarstic depression which is lined with superficial deposit (the superficial deposit is clay, loess and clay with limestone debris), the number of dolines is 8 and their density is 0.04 doline/100 m2. In this area, there are also several fossilized suffosion dolines. Its bedrock is Jurassic limestone.
Pádis is separated into two areas: A surface separated into mounds (its elevation is 1200 m-1400 m) and a lower, nearly plain surface (its altitude is 1100 m-1200 m). Drawdown dolines are widespread at the upper level and the lower too, but at the lower level such dolines also occur which are partially or completely lined with superficial deposit. On the cover, the density of suffosion dolines and dropout dolines is high [16]. Its cover is built up of clayey silt and mixed rock debris (sand, sandstone and limestone debris). The measurement area was the area of a large depression (Rachite), where the plain bedrock (Triassic limestone) is dissected by drawdown dolines. Subsidence dolines also developed on the cover filling and covering them, but these also occur on the floor of epigenetic valleys. In the area of Rachite, their number exceeds 130 and their density is 0.52 doline/100 m2.
On Western Mecsek Karst, where the majority of dolines occur, they are at a surface with an altitude of 260 m-380 m, the drawdown dolines are aligned in rows and are lined with superficial deposit. Subsidence dolines occur both inside and outside them. The number of dolines is high, 1200, at some sites the doline density is 80 dolines/km2 [21], but their distribution is uneven. At some sites it is 0.04 doline/100 m2, while at other sites it reaches 0.65 doline/100 m2. The cover is sand-loess, clay and loess, its bedrock is Triassic limestone.
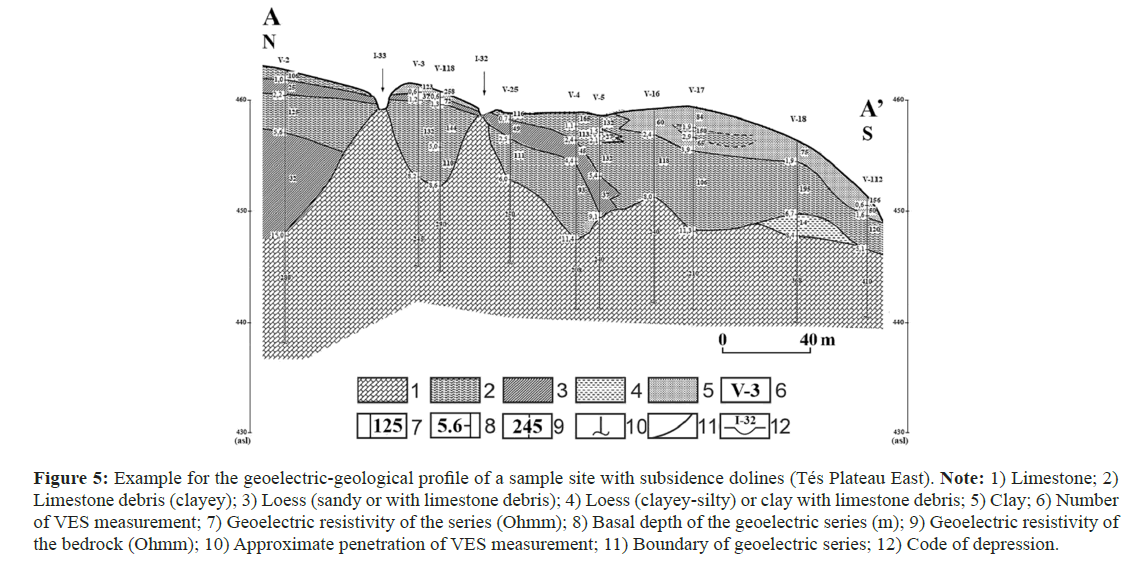
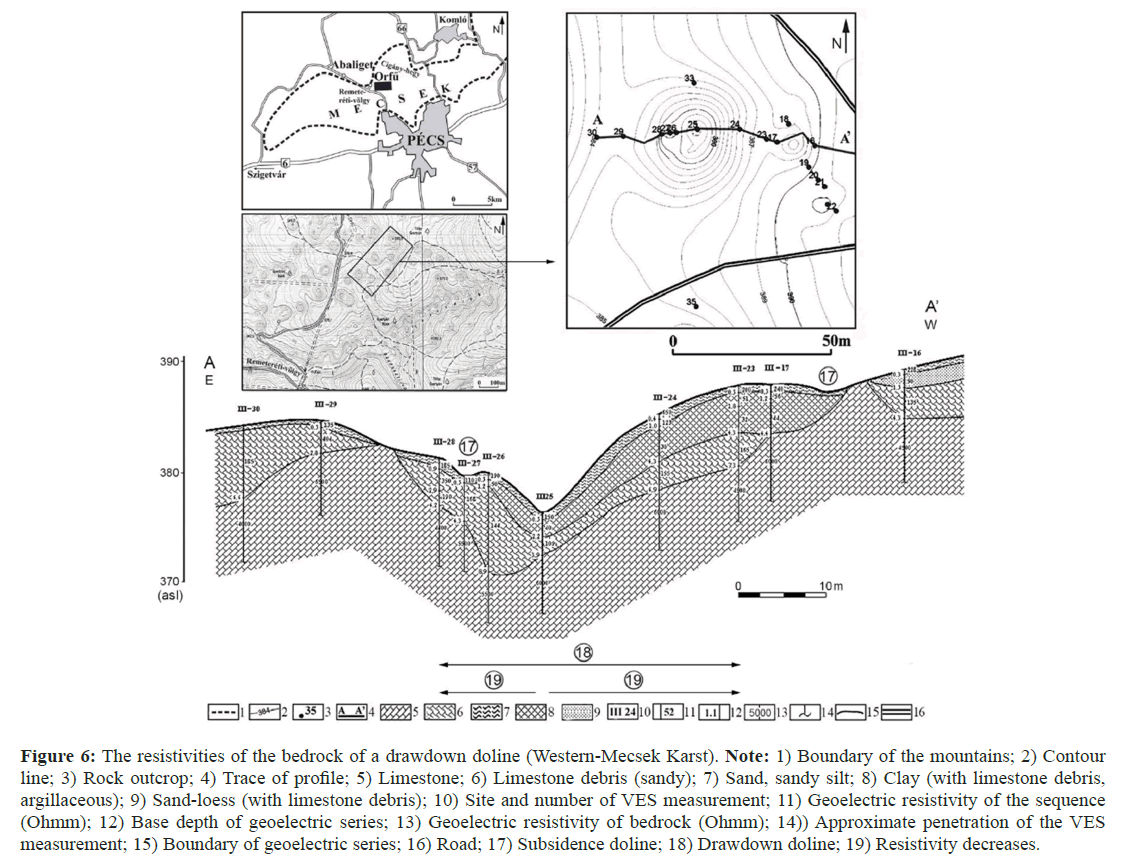
In the selected karstic sample sites, resistivity values were measured by VES method by the colleagues of Terratest Ltd. The principle of measurements can be read in Veress’s work [22]. With the help of the obtained resistivity values, geoelectric-geological profiles were made (Figures 5 and 6). The resistivity values of the bedrock of the profiles that were used in this study are described in (Table 1). The profiles were made in a way that they go through karst features or if a karst feature is a larger, the profile is situated in it.
Figure 5: Example for the geoelectric-geological profile of a sample site with subsidence dolines (Tés Plateau East). Note: 1) Limestone; 2) Limestone debris (clayey); 3) Loess (sandy or with limestone debris); 4) Loess (clayey-silty) or clay with limestone debris; 5) Clay; 6) Number of VES measurement; 7) Geoelectric resistivity of the series (Ohmm); 8) Basal depth of the geoelectric series (m); 9) Geoelectric resistivity of the bedrock (Ohmm); 10) Approximate penetration of VES measurement; 11) Boundary of geoelectric series; 12) Code of depression.
Figure 6: The resistivities of the bedrock of a drawdown doline (Western-Mecsek Karst). Note: 1) Boundary of the mountains; 2) Contour line; 3) Rock outcrop; 4) Trace of profile; 5) Limestone; 6) Limestone debris (sandy); 7) Sand, sandy silt; 8) Clay (with limestone debris, argillaceous); 9) Sand-loess (with limestone debris); 10) Site and number of VES measurement; 11) Geoelectric resistivity of the sequence (Ohmm); 12) Base depth of geoelectric series; 13) Geoelectric resistivity of bedrock (Ohmm); 14)) Approximate penetration of the VES measurement; 15) Boundary of geoelectric series; 16) Road; 17) Subsidence doline; 18) Drawdown doline; 19) Resistivity decreases.
| Site | Mark of profile | Resistivity at VES measurement site (resistivity in brackets) |
|---|---|---|
| Tés Plateau East | A-A’ | 1 (430), 2 (350), 3,(270), 4 (244), 5 (260), 6 (245), 7 (290), 8 (250), 9 (295), 10 (240), 11 (240), 12 (210), 13 (360), 14 (410) |
| Homód Valley | A-A’ | 1 (390), 2 (170), 3 (310), 4 (220), 5 (440), 6 (550), 7 (160), 8 (200), 9 (190), 10 (270), 11 (520), 12 (470), 13 (200), 14 (190), 15 (170), 16 (520), 17 (440), 18 (200) |
| Răchite | A-A’ | 1 (9700), 2 (9200), 3 (13000), 4 (12000), 5 (11110), 6 (11500), 7 (10500), 8 (11110), 9 (12000), 10 (11200), 11 (9800) |
| Eleven-Förtés doline group | K-K’ | 1 (380), 2 (1100), 3 (1100), 4 (480), 5 (620), 6 (870), 7 (1100), 9 (660), 10 (440), 11 (520) |
| Mester-Hajag North | XIII-XIII’ | 1 (1800), 2 (2000), 3 (1000), 4 (1600), 5 (1500), 6 (1800), 7 (2000), 8 (1100), 9 (1400), 10 (1200), 11 (1200), 12 (1100) |
| Western Mecsek Karst | A-A’ | III-29 (6500), III-28 (4400), III-27 (5500), III-25 (6000), III-23 (4500), III-17 (6000) |
Table 1: The resistivities of the karst area that was included in the study.
Some studied areas some were put into pairs, which was also done at several sample sites. The significance of the resistivities of the profiles of paired areas relative to each other was studied by t-test [23] and the arithmetic mean (x̄ T; x̄ P) of the resistivity values of every studied pair (Ohmm) and the standard deviation of the series of data (± ST; ± SP).

• where n is the number of data elements of one of the sample sites (T1:Tés)
• m is the number of data elements of the other sample site (for example Rachite)
• x̄ T is the arithmetic mean of the data elements of one of the sample sites (for example Tés);
• x̄ P is the arithmetic mean of the data elements of the other sample site (for example Rachite).
• ST2 and SP2 are the sample variances of the data elements belonging to the given area. Standard deviation was described graphically. The data taken into consideration in the calculation are one-sided because the data number of sample sites is few (15-30) and the distribution of the values of the data does not correspond with the distribution of the Gaussian function. Thus, the following correlation was chosen for the significance analysis of one-variation, one-sided data of the two samples:

The next step is the selection of the null hypothesis of t-test. In the case of null hypothesis (t0) the arithmetic mean of the pair with the samples to be studied is statistically the same. This was not fulfilled in our study. Therefore, an alternative hypothesis was created which is the following: The measurement data of the two sample sites are significantly different. Our study was a 0.05 i.e., 5•10E-2 significance level was defined when its t0 value was assigned to it from a table.
The t-test values of each sample site pair were put into order based on their magnitude. The of the two areas, the t-test values of which are larger than t0, resemble each other more and those at which the t-test value is smaller than t0, are less similar. The similarity applies to the total volume of cavities. With t and t0 values, an order can be set up in the total volume of cavities in the case of more than two sample sites.
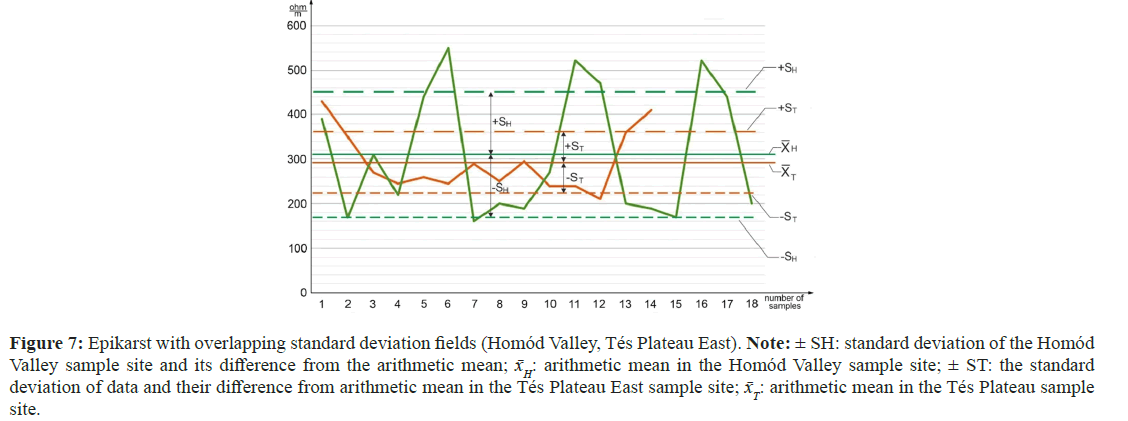
The results of the significance analysis were also described graphically, the horizontal axes represent the distance of measurement sites relative to the initial measurement site, while the vertical axes represent resistivity values. Here, the arithmetic mean of the resistivities of every profile, the standard deviation of resistivities, the difference of standard deviations from arithmetic mean with positive and negative sign and the standard deviation field were described. The standard deviation field is enclosed by the lines with positive and negative signs that express the difference of standard deviations from the arithmetic mean (Figures 7-9).
Figure 7: Epikarst with overlapping standard deviation fields (Homód Valley, Tés Plateau East). Note: ± SH: standard deviation of the Homód Valley sample site and its difference from the arithmetic mean; x̄H: arithmetic mean in the Homód Valley sample site; ± ST: the standard deviation of data and their difference from arithmetic mean in the Tés Plateau East sample site; x̄T: arithmetic mean in the Tés Plateau sample site.
Figure 8: Epikarst with different standard deviation field (Mester-Hajag North, Răchite). Note: ± Sp: the standard deviation and the difference from the arithmetic mean in the Răchite sample site, , x̄P: arithmetic mean in the Răchite sample site, ± SMH: the standard deviation and the difference from the arithmetic mean in the Mester-Hajag North sample site, x̄MH: arithmetic mean in the Mester-Hajag sample site.
Figure 9: Epikarst with touching standard deviation fields (Eleven-Förtés doline group and Mester-Hajag North). Note: ± SMH: the standard deviation of data and their difference from the arithmetic mean in the Mester-Hajag North sample site; x̄MH: the arithmetic mean in the Mester- Hajag North sample site, SEF the standard deviation of the data and their difference from the arithmetic mean in the sample site of Eleven-Förtés doline group, x̄EF: the arithmetic mean in the sample site of Eleven-Förtés doline group.
Results
First, the theoretical, general relationship between the studied parameters (the value of t-test, the change of the arithmetic mean of resistivities, the difference of standard deviations from the mean value, the interval of standard deviation fields) and the characteristics of the epikarst (total volume of cavities, volume without water, the heterogeneity of cavity sizes) is investigated.
If the value of the arithmetic mean is high in the sample site (Table 2), the total volume of dry cavities is also high. The lower this value, the higher the proportion of the total volume of cavities filled with water relative to dry cavities. If the total volume of dry cavities is high relative to the cavities filled with water, the piezometric level is deeper, if this value is low, the piezometric level is more elevated. When the values of standard deviation show great differences from arithmetic values, the total volume of dry cavities is high and the heterogeneity of all the cavities is also high. The higher resistivities occur, the more heterogeneity refers to dry cavities.
| Compared sample sites | Value of t-test | Position of standard deviation fields | Arithmetic mean (ohmm) | Standard deviation (ohmm) | Surface features (doline) |
|---|---|---|---|---|---|
| Tés Platea East, Homód Valley | 0.31 | Overlap | 292.43 | 68,43 | Subsidence |
| 311.67 | 143.09 | Subsidence | |||
| Eleven-Förtés doline group Mester-Hajag North | 2.02E-05 | Touch | 760.91 | 297.81 | Subsidence |
| 1475 | 362.13 | Subsidence | |||
| Homód Valley Răchite | 1.02E-11 | Do not overlap | 143.09 | 311.77 | Subsidence |
| 1197.32 | 1101.91 | Subsidence and drawdown | |||
| Mester-Hajag North, Răchite | 3.09E-12 | Do not overlap | 1475 | 362.13 | Subsidence |
| 11010.91 | 1137.23 | Subsidence and drawdown | |||
| Western Mecsek Karst, Răchite | 5.50E-10 | Do not overlap | 5565 | 755.31 | Subsidence and drawdown |
| 11010.91 | 1134.23 | Subsidence and drawdown |
Table 2: The t-test, arithmetic mean and standard deviation values of the studied sample sites.
In the case of great intervals of standard deviation fields, the heterogeneity of cavities is also high. The greater the fluctuation of resistivities, the greater the difference between the total volume of dry and water-filled cavities, in favour of dry cavities. Positive standard deviations represent dry cavities, while negative standard deviations represent water-filled cavities.
When comparing the epikarst of sample sites, the values of the t-tests of the sample site pairs and the position of standard deviation fields relative to each other have to be taken into consideration. If the value of t-test is high (or higher than at another pair of sample sites), the epikarst of those with higher t-values are more similar to each other than the epikarsts of those with a lower t-test value (Table 3).
| Compared sample site | t-test | Comparison of the characteristics of the epikarst | t0 |
|---|---|---|---|
| Mester-Hajag North and Răchite | 3.0921172-12 | Extremely different | 0.03 |
| Homód Valley and Răchite | 1.02E-11 | Very different | 0.065 |
| Western Mecsek Karst and Răchite | 5.50E-11 | Very different | 0.065 |
| Eleven-Förtés doline group and Mester-Hajag North | 2.02E-05 | Different | 0.6 |
| Tés Plateau East and Homód Valley | 0.3101 | Similar | 0.55 |
Table 3: The degree of differences between the epikarsts of the studied sample site pairs based on t-test values.
The standard deviation fields may overlap each other or are far from each other, or are close to each other. The more different the standard deviation fields from each other, the larger the difference between the arithmetic means and the smaller the differences, the more they coincide. In the former case the difference of the total volume of the cavities of the epikarst is large, in the latter case, it is small. The more different the position of the two standard deviation fields relative to each other, the larger the differences of the total volume of the cavities.
In a sample site, a high resistivity results in high standard deviation, which increases the chance of the overlapping of standard deviation fields in spite of the fact that arithmetic means fall close to each other.
If the standard deviation fields overlap each other, the characteristic features regarding the degree of the cavity formation in the epikarst (for example the total volume of dry cavities, cavity heterogeneity, the position of the piezometric surface) are significantly similar. If the two fields do not overlap each other, the above characteristic features of the epikarst are different from each other.
Discussion
In the case of lower mean resistivities, there is a higher chance of standard deviation fields of sample sites to overlap or touch, while in the case of those with higher resistivities, there is not.
The former group involves the sample sites of the Bakony Mountains. Therefore, the characteristic features of the epikarst of the sample sites of the Bakony Mountains are similar. Therefore, in this area, the piezometric level is of more elevated position than in Rachite, or the Western Mecsek Karst. In the areas of the Bakony Mountains, the characteristic features of cavity formation in the epikarst show significant similarities. The total volume of cavities is similar or nearly similar, but the volume of dry cavities is low. Therefore, cavity heterogeneity is also lower, which is also supported by low standard deviation values and smaller resistivity changes (see below).
The difference of standard deviation fields is particularly large in the case of sample sites with different landscapes, but a difference may even occur in the case of those with similar landscape (Rachite, Western Mecsek Karst). In the former case, the reason for this is that during its development the cavity formation of the epikarst is becoming more and more heterogeneous, In the latter case, the explanation for this is that in the sample sites of the Bakony Mountains, there are standard deviation fields with low intervals (particularly in the case of Tés-Plateau East and Homód Valley).
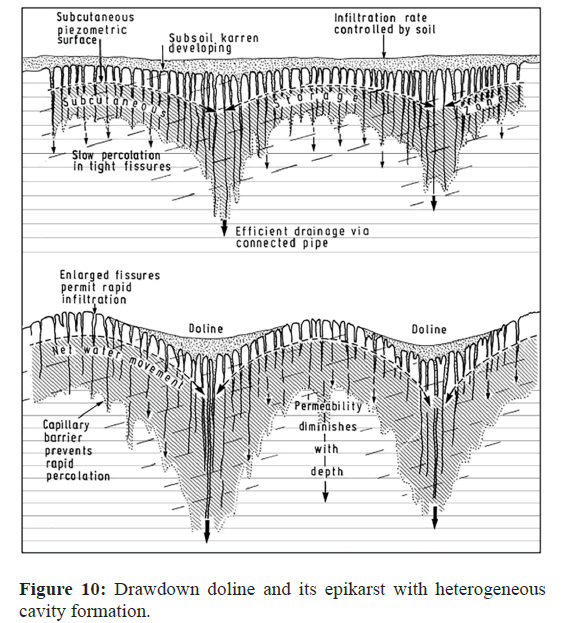
The standard deviation fields of wide intervals of areas with drawdown dolines (and their high average resistivities) refer to a low piezometric surface and high total volume of dry cavities, while high standard deviations indicate high cavity heterogeneity. These characteristic features are in accordance with the characteristic features of the epikarst below drawdown dolines [5,14,24] (Figure 10). In the latter area, the large standard deviation field differences of areas with drawdown dolines and of the sample sites of the Bakony Mountains (since their standard deviation intervals are low) refer to an elevated piezometric level and low total volume of dry cavities. The low total volume of dry cavities allows low cavity heterogeneity (but the small changes of resistivities also refer to this), which is a satisfactory explanation for the lack of drawdown dolines in the Bakony Mountains.
The above things are supported by the comparison of t-test values of sample sites with different pairing (Table 3). The t-test values of each sample site pair express the degree of the difference of their epikarsts. If the epikarst affects surface feature development, the difference of karstification of sample sites with smaller epikarst differences (low t-values) is also smaller than in sample sites where the t-value is higher.
Low t-test values can be observed at the values of sample site pairs of Rachite and of the Bakony Mountains. This is in accordance with the karstification characteristics of sample sites. In the area of Rachite, there are many large subsidence dolines (but, on the bedrock there are also buried drawdown dolines and in some places, they are not buried). In the area of Rachite, the density of subsidence dolines exceeds 0.5 doline/100 m2, the number of those with a diameter larger than 5 m is 20 doline. On the contrary, in the sample site of the Bakony Mountains the doline density is less than 1 doline/100 m2 (the number of dolines is below 20), the number of dolines with a diameter larger than 5 m remains below 5 everywhere.
There is high t-value in the cases of Tés Plateau East and Homód Valley. The characteristics of the karst features of the two sample sites show great similarity. In the Tés Plateau East, the number of dolines is 17, the density is 0.04 doline/100 m2, a diameter larger than 5 m occurs in the case of 5 dolines. In the case of Homód Valley, the number of dolines is 22, their density is 0.69 doline/100 m2 and a diameter larger than 5 m occurs in the case of 2 dolines. Their similarity of great degree (regarding the epikarst and surface karstification) can be explained by the fact that these sample sites are areic with a thick cover [11]. On the contrary, relative to the former pair of sample sites, at the sample sites of the Eleven-Förtés doline group and Mester-Hajag North, which have surface streams, the t-value is lower, but this value does not reach the values of the areas with different doline types, (Rachite, Mester Hajag North, Table 2). In the area of the Eleven- Förtés doline group, the number of dolines is 8, their density is 0.04 doline/100 m2 and there are 3 dolines, the diameter of which is larger than 5 m. In the Mester-Hajag North sample site, the number of dolines is 10, the density is 0.03 doline/100 m2 and there are no dolines with a diameter larger than 5 m. However, out of the two pairs of sample sites, in the case of the Eleven Förtés doline group and Mester Hajag North, the lower value of t refers to the lower degree of cavity formation in the epikarst, which is in harmony with the fact that here, the degree of karstification is lower than in the case of the sample site pair of Tés Plateau East and Homód Valley.
Conclusion
The resistivity that can be measured in limestones is also affected by secondary porosity. The bedrock resistivities of limestones with cover were measured and analysed statistically.
The value and arithmetic mean of bedrock resistivities, the difference of standard deviation from the mean, the fluctuation of resistivities along a profile, the magnitude of the interval of standard deviation field, the position of standard deviation fields of sample site pairs relative to each other and the t-values refer to the characteristics of the epikarst. The collision of standard deviation fields refers to similar epikarst, the arithmetic means of high resistivities refer to high total volume of cavities, while the difference of standard deviations from the arithmetic mean and the fluctuation of resistivities refer to great cavity heterogeneity.
The higher the arithmetic means of resistivities, the higher the total volume of cavities of the waterless epikarst of sample sites and of the greater degree surface karstification. The greater the difference between the epikarsts of the two sample sites, the lower the t-test value in the paired sample sites.
Low t-values can be observed when comparing karsts with drawdown dolines and karsts with subsidence dolines. However, significant differences and thus, low t-values may occur among areas with similar surface morphology too (Rachite, Western Mecsek Karst).
References
- Mangin A (1975) Contribution to the hydrodynamic study of karst aquifers. Annales et Speleologie 29(3): 283–332.
- William W, David CC , Bakalowicz M (2019) Epikarst. Encyclopedia of Caves 3:394-398.
- De Waele, Gutiérrez F (2022) Karren and sinkholes. Hydrogeol Geomorphol Cav 6:336-465.
[Crossref]
- Klimchouk AB (2004) Towards defining, delimiting and classifying epikarst: Its origin, processes and variants of geomorphic evolution. Epikarst 9:23-35.
- Williams PW (2008) The role of the epikarst in karst and cave hydrogeology: A review. Int J Spel 37 (1):1-10.
- Milanović P (1979) Karst hydrogeology and methods of investigation. Trebinje.
- Al Fares W, Bakalowicz M, Guérin R, Dukhan M (2002) Analysis of the karst aquifer structure of the Lamalou area (Hérault, France) with ground penetrating radar. J App Geophy 51(2-4):97-106.
- Jones WK (2013) Physical Structure of the Epikarst. Acta Carsologica 42(3):311-314
- Csókás J, Egerszegi P, Vitális Gy (1968) Geoelectrical measurements in the western part of Váci Nagyszál Geological research 11: 31-35.
- Renner J, Salát P, Stegena L, Szabadváry L, Szemerédy P (1970) Geophysical research methods III Surface geophysics 1:413.
- Veress M, Deak G, Mitre Z (2023) The Vertical Electrical Sounding (VES) of the epikarst: A case study of the covered karst of the Bakony region. Acta Carsologica 52(2-3): 245-258.
- Veress M (2020) Karst types and their karstification. J Earth Sci 31(3):621-34.
- Sweeting MM (1973) Karst Landforms. Columbia University Press, New York, 362 p.
- Waltham AC, Fookes PG (2003) Engineering classification of karst ground conditions. Quar J Eng Geol Hydrogeol 36(2):101-18.
- Williams PW (2004) Dolines Encyclopedia of Caves and Karst Science. 1:304–310
- Ford DC, Williams PW (2007) Karst Hydrogeology and Geomorphology. John Wiley. 562.
- Veress M. (2016) Covered Karst. Springer 536.
- Alemdag H, Köroğlu F, Aydın ZÖ, Şeren A, Babacan AE, et al (2024) Deciphering of karst geomorphology and sinkhole (doline) structures using multiple geophysical and geological methods (Trabzon, NE Türkiye). Bul Eng Geol Environ 83(7):286.
- Veress M (2024) Interaction between the epikarst and surface karstification. Springer.
- Veress M (2022) The surface morphology of karsts in Hungary. Cav Karst Sys Hun 1:179-247.
- Lippmann L, Kiss K, Móga J (2008) Investigation of the karstic phenomenon near Orfű and Abaliget. GIS methods Karsztfejlődés 13:151-166.
- Veress M (2009) Investigation of covered karst form development using geophysical measurements. Zeitschrift fur Geomorphologie. 53(4):469.
- Exceel (2019)
- Williams PW (1985) Subcutaneous hydrology and the development of doline and cockpit karst. Zeitschrift fur Geomorphol Stuttgart 29(4):463-82.
 Spanish
  Chinese
  Russian
  German
  French
  Japanese
  Portuguese
  Hindi
Hindi 